Schedule Risk Analysis Results
Risk Exposure Chart
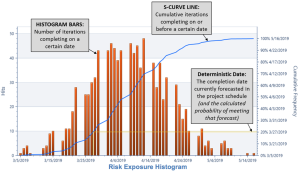
The first, and higher level output, is the Risk Exposure Chart. This chart depicts the level of confidence that the project scope, as modeled in the IMS, can be completed by a certain date. The chart commonly includes a histogram depicting the number of project simulations that are being completed on each specific date, and a curve that shows the cumulative values across time up to a 100% confidence level. Using the Deltek Acumen Risk Exposure histogram, the baseline finish, forecasted finish or any other desired date can be examined, as well as determination of the probability of achieving that date based on the number of simulations completing on or before that point in time.
Now that you know there are problems, what are you going to do about them? On which tasks should mitigation attempts be made? Is the current critical path comprised of the riskiest tasks? This is where the second area of intelligence output comes into play.
Tornado Chart
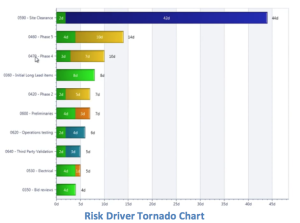
Acumen produces a list of “risk drivers” in the form of a Tornado Chart. These are the tasks that are expected to have the greatest influence on risk in the schedule. Put another way, this report highlights the tasks that, if they could be executed in less time, would have the greatest impact on increasing the likelihood of an on-time project completion. Acumen’s rendition of the Tornado Chart also displays the amount of the risk that can be attributed to duration uncertainty, logic, or any of the risk events. New to Acumen 6.1 is the ability to easily display this information in either days or hours.
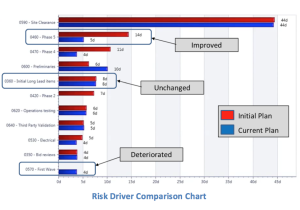
But how does one know if all of the time and effort that has been spent mitigating risk is working? Acumen can help here too. The initial (unmitigated) plan can be compared to the current (mitigated) plan. Has risk been reduced as expected? Or, because of mitigation efforts in one area, has risk increased in other areas (a.k.a. collateral damage)? Stacking the results within the Tornado Chart, it can quickly be seen which risk drivers improved, were unaffected, or deteriorated.
Parting Thoughts
The goal of any SRA tool is to identify and quantify schedule risk to a project so that action can be taken to improve project execution. Used properly, Acumen Risk does exactly that. With over 20 years as a full-time scheduler, I have dealt with thousands of project schedules and many, many analysis tools. From what I have seen so far, Acumen is an evolutionary step in performing schedule risk assessments. It offers beginners an easy path to perform in-depth schedule analysis with advanced features for more experienced users to help further refine the accuracy of the results. I encourage you to register for a free trial version and test it out for yourself.
Yancy Qualls, PSP
Engagement Director, Schedule Subject Matter Expert
Humphreys & Associates, Inc.
How do I register for a trial version?
Pingback: Video Release - Assessing Schedule Risk Using Deltek’s Acumen Risk 6.1 | Part 2 of 2 - Humphreys & Associates