schedule risk analysis

Maximizing the Value of Schedule Risk Assessments (SRAs)
, , , , , , , ,

Quick Summary

  • SRAs are only as valuable as the intent and quality behind them. Treating them as a check-the-box compliance requirement produces meaningless results that get filed away and never used.
  • Real-world examples show how cost pressure and last-minute guidance changes at kickoff can derail an SRA, leaving project teams with outputs no one trusts or acts on.
  • Focusing three-point estimates on tasks that drive critical and near-critical paths delivers real insight without the prohibitive cost of analyzing every task in a large IMS.
  • Documented assumptions for selected tasks produce derived duration factors that are far more accurate than gut-feel percentages, and the difference shows up directly in the SRA results.

A previous blog, Schedule Risk Assessment Fundamentals, highlighted that when properly used, schedule risk assessments (SRAs) are a powerful management tool that can contribute to project success. It does, however, require a high-quality integrated master schedule (IMS) that is integrated with a disciplined risk management process. When conducted with the intention to gain a realistic view of schedule outcomes and risk drivers, it provides management with additional insight and an early warning indicator of potential threats to meeting schedule objectives.

The Challenge with Conducting SRAs

Schedule risk assessments are frequently a topic of discussion in project management circles and sometimes for the wrong reason. A well-run SRA can provide the confidence levels for achieving different schedule end dates as well as valuable insight into the IMS. However, the SRA is particularly susceptible to the “garbage in – garbage out” (GIGO) principle.

H&A consultants have recently observed discussions that indicate SRAs are not being properly performed or used to help manage projects. Some of these observations reinforce the GIGO principle.

One H&A senior consultant sat in on a meeting with the government program manager for a large project where the consultant, having worked on the just-completed SRA, asked the government program manager what they would do with the results. The amazingly honest answer was, “Sadly, it will just be filed. It is seen as a check-the-box thing we have to do.”

Using the results of the SRA to stuff the drawer might not be as wild a response as it seems. Too many times, we see the SRA being done in a perfunctory manner using inputs that will not yield useful management information and insight. One way people are cutting corners on the SRA is by applying global factors to the existing duration estimates and running the simulation with those durations. Applying a formula across the board is not the same as analysis. Yes, the SRA can be done so poorly it is meaningless. This is especially true if the applied factors are not realistic.

An Example of What to Avoid

One of our consultants observed that in one case the best of intentions were thwarted in the SRA by cost pressures and lack of management commitment. The manager of the SRA provided a form to each CAM for them to provide the best case, worst case, and most likely case duration estimates and provide written explanations for all three cases. The instructions were for the CAMs to use the form for every incomplete task and future task.

There were about 10,000 such tasks distributed among 70 or so CAMs. On average, that would be 140+ tasks for each CAM. Doing three-point estimates for 140 tasks would be a large expense and consume a lot of valuable time, without even mentioning the cost.

The government program manager, who pays the bills, was present at the kickoff meeting for the SRA and intervened immediately when he heard the directions being provided. He stated that he would not pay for all that effort; it would be too costly. Unfortunately, there was no probing to find out what would be reasonable to this manager in terms of details for the SRA.

Instructions for this SRA were revised on-the-fly and the SRA was done. It was done poorly; in some parts due to the disruption at the kickoff meeting and the poor guidance. The intervention of the government program manager had left the impression that the SRA “was not worth it.” That impression was wrong.

The idea of documenting the three-point estimates is a good one, but too time-consuming to be applied to every task. There are valid options that can still benefit from this detailed look at the durations, yet avoid the significant expense of analyzing all the tasks.

A Better Approach

One approach is to do a detailed analysis of the three-point estimates for specific selected tasks that reduces the number of tasks that require detailed manual estimation. The focus should be on the tasks that provide insight into the part of the IMS most likely to cause the end date or a major event date to change. Examples include those tasks that are:

  1. On one or more of the top number of critical paths.
  2. On the path to the next major event (these tasks can be found using the driving path approach).
  3. Known to be or assumed to be prone to duration risk.
  4. Known to require scarce resources that may have limited availability.
  5. Believed to be drivers of duration risk for other reasons.

A simple example will help to understand why documenting the three-point estimates for some tasks is basic to achieving a useful SRA. If you, acting as a CAM, were asked to estimate the time required to drive 10 miles from your home to work by car in a hypothetical town, you would want to understand the scope of the effort. A drive of 10 miles through the countryside, or on a freeway, or on city streets can be very different.

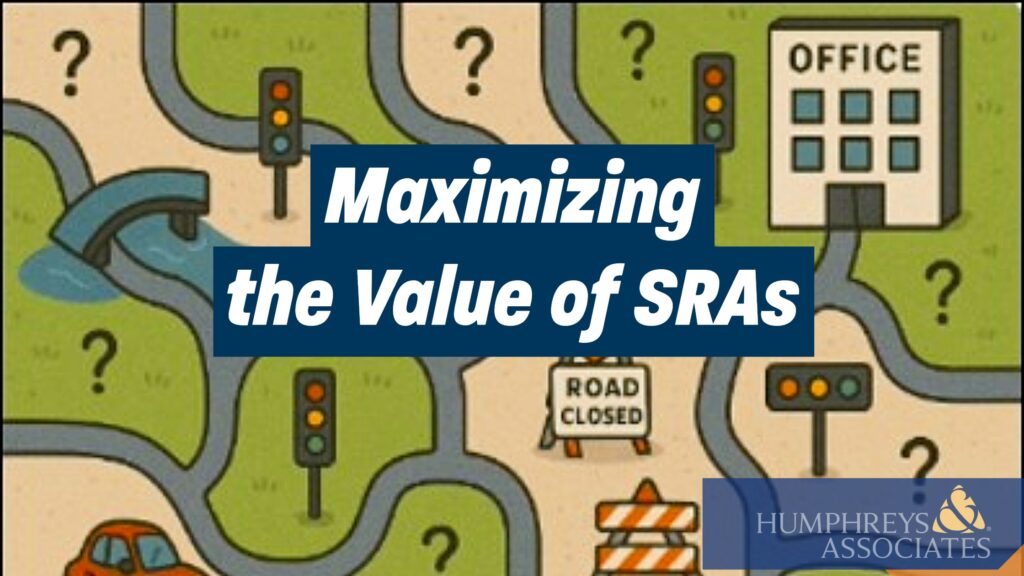
stylized road map of confusing roads

Some help with the assumptions could improve your estimate. If you were told that the first 5 miles of the drive was in town, where the speed limit is 25 mph with the potential for red lights along the way, and the last 5 miles is on the freeway, where the speed limit is 60 mph, this would help you produce a better estimate.

In fact, you will get a better estimate by understanding the scope, the assumptions, the risks, and so on. When doing the three-point estimate, you would employ a process that includes these steps that consider:

  1. The nature of the task. What exactly is to be done in the task?
  2. Past experience. Have we done this or similar work before?
  3. Capabilities. For example, can you drive, does your car work well, can you go up to 60 mph in your car, do you have gas, and are you equipped for potential weather?
  4. Assumptions. How many traffic lights are there along the way? How long would you wait at a red light? What time of year is it? What day of the week? What time of day?
  5. The risks. Are there possible road issues, such as construction? How about traffic issues? Accidents?

Now, suppose you were required to document your estimated durations. Using the assumption details from above, you might end up with this:

CaseDurationAssumptions
Best17 minutesA dry day, early in the morning before traffic, you have all green lights, and you obey the speed limit.
Most Likely23 minutesThe road is fine, first 5 miles is at 25 mph. Only 2 red lights with a wait time of 2 minutes each, and 7 minutes for freeway travel at 45 mph.
Worst Case32 minutesThe road is slippery and you can only travel at 20 mph. You must stop at 3 red lights and sit for 2 minutes each. You have one unexpected stop for 4 minutes because of other drivers. Also, the freeway speed is only 45 mph.

You now have a set of durations you can use in the SRA. You also have the details needed for explaining the duration estimate. Additionally, there is enough information to be able to change the estimates if presented with new facts or revised assumptions. For example, perhaps the project’s period of performance moves to the right and the work will now be performed in the winter. You can adjust your estimates for winter weather impacts.

You also have enough information to be able to derive factors to be used in formulae to generate three-point estimates for other tasks. Be careful to make sure you only use the information to generate a factor on similar work. In this case, the factors would be -26% and +39%. Those are derived factors. For comparison, a common “gut feel” reaction to the question of what factors should be used is usually more like minus 5% and plus 10%. Using derived factors versus a “gut feel” will yield significant differences in the SRA and the value of the results.

Recommendations to Increase the Value of an SRA

Begin with the intention to treat the SRA as the important and valuable tool it is. Choose to change the approach from a “check-the-box” or compliance mentality into a straightforward process that helps to produce a more realistic and executable IMS. No one likes schedule or resulting cost surprises as discussed in another blog, Maintaining a Credible Estimate at Completion (EAC), that also addresses why a credible forecast completion date is equally important. Here are a few suggestions to improve your approach to conducting SRAs:

  1. Provide clear, specific directions to project personnel on what is expected. Highlight why the SRA is an important step.
  2. Verify a quality IMS has been established.
  3. Validate the risk information.
  4. Do focused analysis of discrete tasks on a given number of critical and near-critical paths and document the rationale for the best/worst/most-likely case durations.
  5. Do focused analysis on driving path tasks if not on the critical paths.
  6. Do focused analysis on known risks.
  7. Use realistic factors derived from reality when applying factors to the larger body of IMS tasks.

Taking Action

Producing a quality IMS takes skilled master schedulers that understand the management and predictive value of a well-constructed schedule. The next step up to improve the realism of the IMS is to conduct an SRA when it makes sense. Examples include conducting an SRA as part of the process to establish the baseline schedule, when there is major change, or before a major event such as a Critical Design Review (CDR).

It is not an easy task to distill the steps to conduct a value-added SRA into a well-defined and useful process. H&A master schedulers and risk subject matter experts often work with clients to establish a pragmatic SRA process. They also train and mentor project teams on how to use the SRA outputs to produce realistic schedules with a higher probability of success. Call us today to get started.

Maximizing the Value of Schedule Risk Assessments (SRAs) Read Post »

Understanding the As Late As Possible (ALAP) Scheduling Option in Practical Terms

, , , , , , , , , ,
Understanding the As Late As Possible Scheduling Option in Practical Terms

Many project professionals have spent entire careers without ever using the As Late As Possible (ALAP) scheduling option, although the underlying idea feels familiar. Why? Because it’s very similar to the “just-in-time” concept widely used in manufacturing and logistics.

In materials management, just-in-time means having what you need arrive exactly when you need it, minimizing storage costs and reducing inventory. The same principle can apply to project labor, but with some important cautions.

The “Right Time” for Project Work

On development or design projects, doing work too early can be counterproductive. If designs change, early work may become obsolete, forcing costly rework. The “right time” to perform a task is often determined by schedule logic. In some cases, however, it can also be guided by the ALAP constraint.

Before we explore when ALAP makes sense, let’s quickly review the two primary constraint options in Microsoft Project (and most other scheduling tools).

ASAP – As Soon As Possible

As soon as possible:

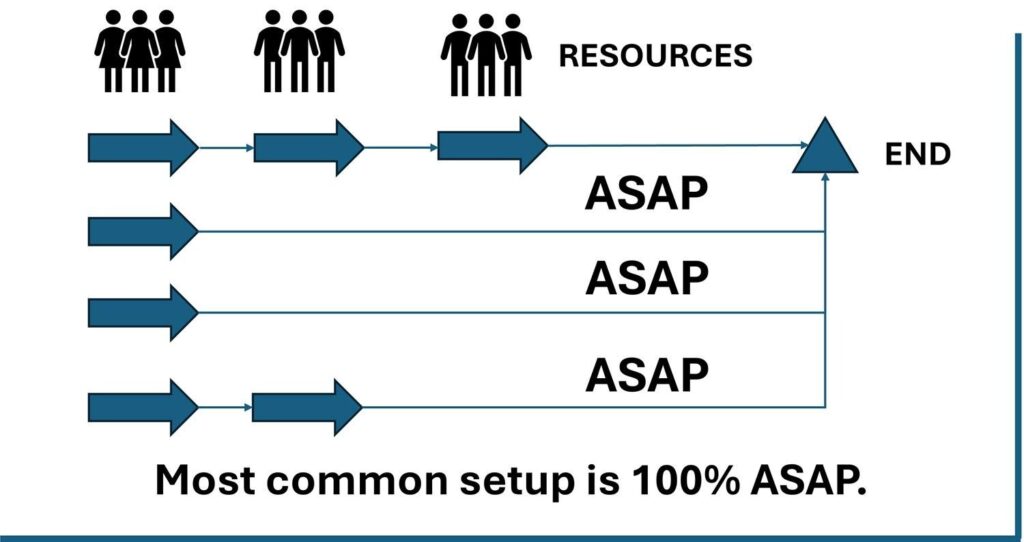
  • Is the default setting for forward-scheduled projects (when you set a project start date).
  • Means tasks are pushed as early as possible, immediately after their predecessors finish.
  • Is ideal when you want the earliest possible completion and clear visibility into float/slack.

In an ASAP chain, every task begins at the earliest opportunity, pushing resources as far to the left as possible on the Gantt chart as illustrated in Figure 1.

Figure 1: As Soon As Possible Scheduling Option

ALAP – As Late As Possible

As late as possible:

  • Means tasks are scheduled as late as possible without delaying the successor or project finish date.
  • Is used in backward-scheduled projects (those planned from a fixed finish date) or when you want to defer work until the last responsible moment.
  • Microsoft Project automatically places each task at the latest feasible start date that still satisfies all constraints.

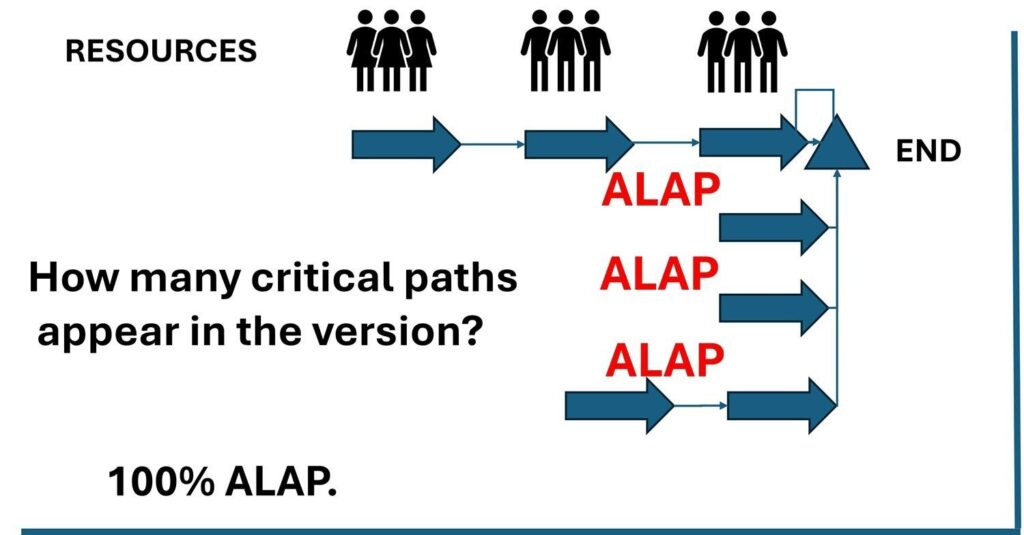
Switching a chain of tasks to 100% ALAP dramatically shifts all work to the right on the timeline as illustrated in Figure 2. The impact on management is significant: Every task now has zero total slack, which means any delay, even one day, directly delays the project finish. Multiple paths can appear “critical,” making control and reporting more complex.

Figure 2: As Late As Possible Scheduling Option

When ALAP Makes Sense

There are legitimate reasons to use ALAP selectively. For example:

  • When a task consumes resources you don’t want engaged early (e.g., expensive equipment rental or specialized consultants).
  • For just-in-time deliveries or procurements where early completion has no benefit.
  • When modeling backward scheduling. For instance, working from a fixed delivery date toward today.
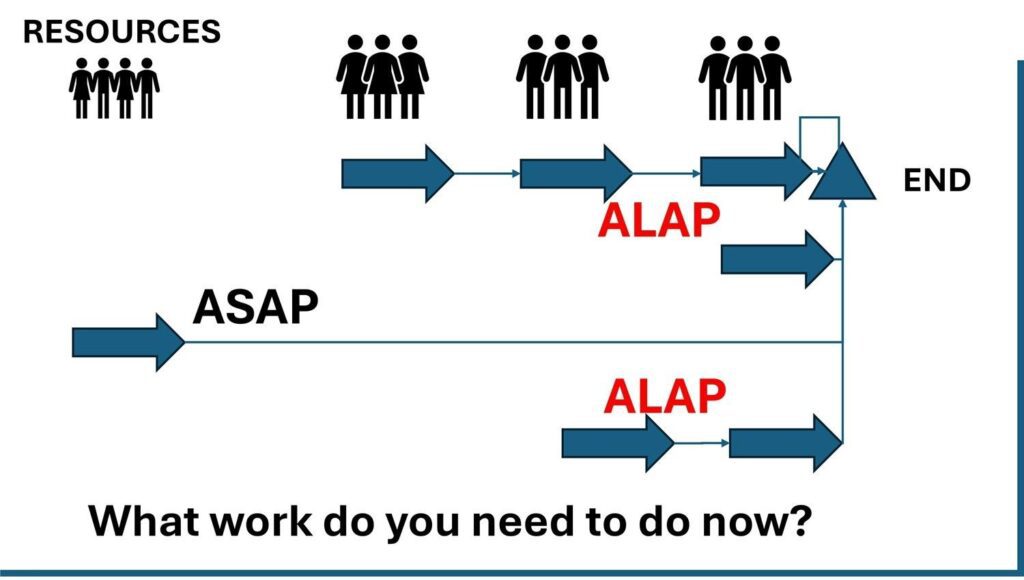
  • A mixed schedule. Mostly ASAP but with a few ALAP tasks can balance flexibility, cost control, and realism as illustrated in Figure 3.
Figure 3: A Schedule Using ALAP and ASAP

A Real-World Example

One of H&A’s senior scheduling consultants once faced this exact dilemma while helping to prepare a multi-year, multi-billion-dollar defense proposal for a project with strict annual funding limits. 

With less than two weeks before the submission deadline, the Proposal Director was exasperated: “I keep asking the engineers what can be delayed! Why does everything have to happen up front? The front-loaded schedule is blowing our funding cap!”

A quick inspection revealed the problem: every task was set to ASAP. The entire effort was jammed toward the beginning of the timeline, creating a massive early demand for resources. After several failed attempts to persuade the engineers to move work later, the consultant proposed something unconventional: “Let’s flip the question. Instead of asking what can we delay, let’s ask what must be done now.”

The H&A scheduling consultant converted the entire schedule to ALAP, instantly shifting all work to the far right of the timeline. The resulting view inverted the problem, from overspending early to under-spending, and gave the team a new way to discuss priorities.

In meetings, engineers were asked to move tasks from ALAP to ASAP one at a time, stopping when the annual funding limit was reached. The discussion changed from “Why can’t we do this now?” to “What can we afford to do this year?”

The result wasn’t elegant, but it solved the immediate problem: the funding limits were clearly observed, the resource profile became manageable, and the trade-offs were visible to everyone.

How ALAP Affects Critical Path and Risk

Because ALAP tasks consume all available float, they appear critical even when they may not truly drive the project finish. This can obscure the actual critical path, making it difficult for project managers to distinguish between genuine schedule risks and artificial ones. In Earned Value Management (EVM) environments, this matters. Earned value metrics depend on knowing which tasks drive completion. Excessive use of ALAP can lead to misleading forecasts and distort DCMA data quality metrics such as the Total Float test and the Critical Path test. For this reason, auditors often recommend using ALAP sparingly and documenting the rationale wherever it’s applied. 

Note: in a sophisticated scheduling environment, it is possible to make a copy of the integrated master schedule (IMS) and revert to ASAP to look for critical paths in the normal sense.  

Combining ALAP with Other Constraints

In practice, project managers often use a blend of constraint types. For example, you can combine ALAP with “Must Finish On” or “Start No Earlier Than” dates to simulate external dependencies such as contract milestones, funding release dates, or material delivery windows. This hybrid approach allows the schedule to model reality while maintaining logical control. However, it’s important to track these constraints carefully. Too many “hard” constraints of any type can reduce the schedule’s dynamic nature and make automated forecasting less accurate.

Guidance from Industry and Agencies

Industry and government scheduling guides consistently advise restraint when using ALAP. The DCMA data quality tests consider the presence of ALAP tasks as a potential red flag because they can mask schedule float and obscure the true drivers of program completion. Similarly, the GAO’s Schedule Assessment Guide recommends minimizing artificial constraints and using logic-driven sequencing whenever possible. ALAP may be appropriate for modeling constrained resources or fixed delivery milestones, but it should always be justified and documented. Within DoD and NASA programs, reviewers often require clear evidence that ALAP usage is intentional, controlled, and limited to well-understood modeling cases. It should never be used as a workaround for poor sequencing.

Key Takeaways

  • ASAP emphasizes early starts, clear float visibility, and traditional forward scheduling.
  • ALAP emphasizes delayed starts, tighter resource control, and is useful in backward or funding-constrained planning.
  • Use ALAP sparingly and intentionally as it can obscure float and create multiple critical paths.
  • In creative problem-solving, toggling between ASAP and ALAP can reveal insights about timing, funding, and necessity that might otherwise remain hidden.

Final Thoughts

The ALAP constraint is a powerful but double-edged tool. It can simplify discussions about funding limits, resource phasing, and timing priorities, but it also carries risk if used indiscriminately. Like most features in commercial off the shelf (COTS) scheduling tools, its value depends on the user’s intent and discipline. The best project schedules blend logic, transparency, and flexibility. Understanding when to use ALAP (and when not to) can make the difference between a reactive plan and a truly managed one.

Interested in Learning How to Use More Advanced Scheduling Techniques?

Master schedulers skilled at asking the right questions to solve project management challenges hone their craft based on years of experience and working with other scheduling experts. There are always opportunities to learn more. H&A routinely offers basic, advanced, and tailored scheduling workshops taught by senior master schedulers with decades of experience in all types of project environments using common scheduling tools such as Microsoft Project and Oracle Primavera P6. Give us a call today to get started. 

Humphreys and Associates also offers basic and advanced EVMS training as well as tailored EVMS training that aligns with a client’s EVM System Description. 

Understanding the As Late As Possible (ALAP) Scheduling Option in Practical Terms Read Post »

Risk Analysis and Selective Controls

, , ,


This chapter looks at how risk is evaluated when developing an Earned Value Management System.

Video Contents

You can use the links below to jump to a specific part of the video.
0:00 – A Closer Look at Risk
0:25 – Risk Drives Other Concerns
0:59 – Types of Risk
1:19 – Risk Opportunities
1:38 – Risk Analysis and Selective Controls
1:54 – Balance Cost with Benefit


More EVMS Training

If you liked this video you can purchase the entire course below. This video is an excerpt from the Department of Defense (DOD) version of this eLearning module. We also offer the same course customized for the Department of Energy’s (DOE) specific Earned Value Management (EVM) implementation/requirements, as well as a version of the course customized for NASA’s EVM implementation/requirements.  

— Purchase This Course —
EVMS DOD Virtual Learning Lab

— Purchase the DOE Version of this Course —
EVMS DOE Virtual Learning Lab

— Purchase the NASA Version of this Course —
EVMS NASA Virtual Learning Lab


EVMS Document Matrix

Not sure what the different requirements are between the DOE and NASA? Can’t remember if Cost and Software Data Reporting (CSDR) is required for an NSA contract? Check out our easy to read Earned Value Management Systems Document Matrix


All Online Courses

All Online Courses Available from Humphreys & Associates

Earned Value Training

Other Posts in this Series

Risk Analysis and Selective Controls Read Post »

Assessing Schedule Risk Using Deltek’s Acumen Risk 6.1 | Part 2 of 2

, , , , , , ,

Schedule Risk Analysis Results

Agile assessments identify, evaluate and assigns risk to projects. Schedule risk analysis results are predominantly communicated in two important sets of intelligence.

Risk Exposure Chart

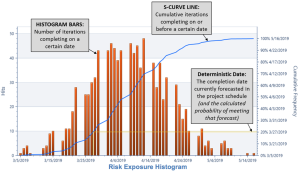
The first, and higher level output, is the Risk Exposure Chart. This chart depicts the level of confidence that the project scope, as modeled in the IMS, can be completed by a certain date. The chart commonly includes a histogram depicting the number of project simulations that are being completed on each specific date, and a curve that shows the cumulative values across time up to a 100% confidence level. Using the Deltek Acumen Risk Exposure histogram, the baseline finish, forecasted finish or any other desired date can be examined, as well as determination of the probability of achieving that date based on the number of simulations completing on or before that point in time.

EVMS: Risk Exposure Chart

Now that you know there are problems, what are you going to do about them? On which tasks should mitigation attempts be made? Is the current critical path comprised of the riskiest tasks? This is where the second area of intelligence output comes into play.

Tornado Chart

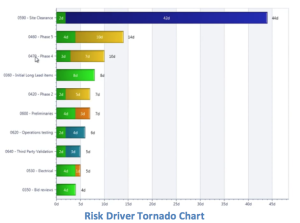
Acumen produces a list of “risk drivers” in the form of a Tornado Chart. These are the tasks that are expected to have the greatest influence on risk in the schedule. Put another way, this report highlights the tasks that, if they could be executed in less time, would have the greatest impact on increasing the likelihood of an on-time project completion. Acumen’s rendition of the Tornado Chart also displays the amount of the risk that can be attributed to duration uncertainty, logic, or any of the risk events. New to Acumen 6.1 is the ability to easily display this information in either days or hours.

EVMS: Risk Driver Tornado

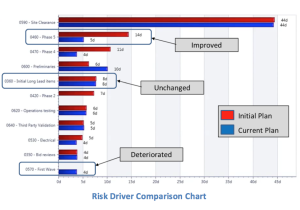
But how does one know if all of the time and effort that has been spent mitigating risk is working? Acumen can help here too. The initial (unmitigated) plan can be compared to the current (mitigated) plan. Has risk been reduced as expected? Or, because of mitigation efforts in one area, has risk increased in other areas (a.k.a. collateral damage)? Stacking the results within the Tornado Chart, it can quickly be seen which risk drivers improved, were unaffected, or deteriorated.

EVMS: Risk Driver Comparison

Parting Thoughts

The goal of any SRA tool is to identify and quantify schedule risk to a project so that action can be taken to improve project execution. Used properly, Acumen Risk does exactly that. With over 20 years as a full-time scheduler, I have dealt with thousands of project schedules and many, many analysis tools. From what I have seen so far, Acumen is an evolutionary step in performing schedule risk assessments. It offers beginners an easy path to perform in-depth schedule analysis with advanced features for more experienced users to help further refine the accuracy of the results. I encourage you to register for a free trial version and test it out for yourself.

Yancy Qualls, PSP

Engagement Director, Schedule Subject Matter Expert

Humphreys & Associates, Inc.

Assessing Schedule Risk Using Deltek’s Acumen Risk 6.1 | Part 2 of 2 Read Post »

Scroll to Top