Assessing Schedule Risk Using Deltek’s Acumen Risk 6.1 | Part 1 of 2
Why Perform Schedule Risk Assessments? EVMS and Agile implementations within the same company or on the same project.
Before a project is ready to be baselined, a typical question the customer asks the project manager is, “How confident are you that the project will finish on time?”
This is a more difficult question than you might think. In competitive environments, guessing is not an option. The probability of success on a project must be quantified. The risks that impact the odds for success must also be quantified. If the risk is managed, the probability of completing the project on time and under budget is improved.
Customers are not blind to the importance of risk management. This is evidenced by recent changes in government contracting requirements that call for formal risk assessments of project schedules. Even if risk management were not a contractual requirement, it would be irresponsible for any project manager to ignore the need for risk management and proceed without identifying and assessing the project’s risks.
Schedule risk exists in every project. This risk can be quantified, analyzed, and mitigated, or it can be ignored. However, ignoring schedule risk does not make it go away. Fortunately, there are advanced software tools, such as Deltek’s Acumen Risk, that can help model the expected impacts of risk in the schedule. Then, the answer to “how confident are you that the project will finish on time?” can be answered with quantifiable information.
In the following sections, a few of the foundational elements of performing a schedule risk assessment (SRA) using Acumen Risk 6.1 will be discussed. The software was designed with the understanding that not everyone is an expert in schedule risk analysis. The software provides beginners with an easy to follow path to perform in-depth schedule risk analysis as well as advanced features for experienced risk experts.
Along with quick start guides and help documentation, the menu structure is laid out like a schedule maturity timeline. From left to right, the menu selections take one from the start-up steps of importing the schedule, to analyzing the schedule, assessing schedule risk, accelerating the schedule, and advanced customization features.
![]() Deltek Acumen – Top-Level Menus
Deltek Acumen – Top-Level Menus
Schedule Health Diagnostics
Before delving into schedule risk assessments, let’s take one minor detour from risk into schedule diagnostics.
Would you trust a broken watch to tell you the correct time? The same goes for a schedule risk assessment. A broken schedule network cannot be trusted to yield reliable, and therefore actionable, SRA results.
The National Defense Industrial Association (NDIA) Integrated Program Management Division (IPMD) Planning & Scheduling Excellence Guide (PASEG), is widely regarded as one of the premier references on scheduling best practices. The PASEG was created by a joint team of both government and industry scheduling experts, thus it has no particular point of view to promote or defend. One of the scheduling best practices the PASEG discusses is that the integrated master schedule (IMS) should be validated before any SRA is performed. “Validated” means that the tasks, logic, durations, constraints, and lags in the IMS should be analyzed and corrected as necessary.
Acumen Fuse provides a complete set of schedule diagnostics. When I first clicked on the “Diagnostics” tab, I saw an initial set of metrics.
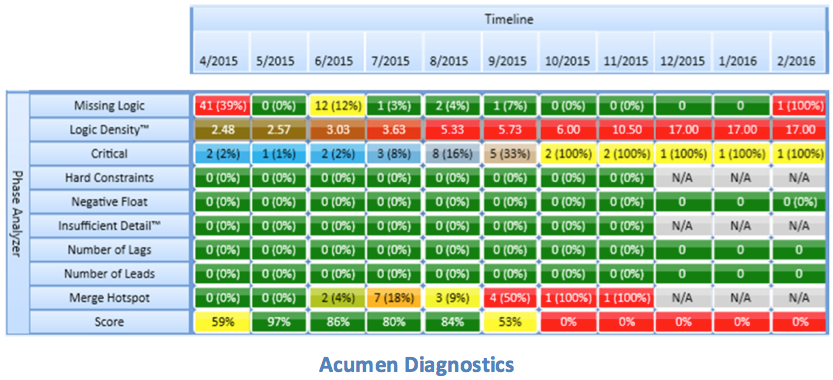
Each one of these metrics was applied to the project’s timeline that which makes it easy to see both where and when the issues occur. What I did not notice at first was that these metrics were just one subset; I was only looking at the “Schedule Quality” subset of the diagnostics. There were similar subsets in the areas of Logic, Duration, Constraints, Float, and the DCMA 14-point Schedule Assessment, just to name a few. All of these diagnostic tests can be modified to reflect your company or customer’s standards.
Before leaving the topic of schedule health, there are a few words of caution. No matter how useful a schedule analysis tool may be, there is no substitute for the task managers taking ownership of the IMS and ensuring that it is in good working order. For example, analysis software can be used to check to determine if a task has a predecessor and a successor, but only someone familiar with the effort can determine if a task has the “correct” predecessor and successor. Analysis software is becoming more and more sophisticated, but people still control the success or failure of the project.
Duration Uncertainty
Once a sound schedule has been developed, the next foundational elements of an SRA are the duration uncertainty estimates. There are two widely accepted methods of assigning duration uncertainty.
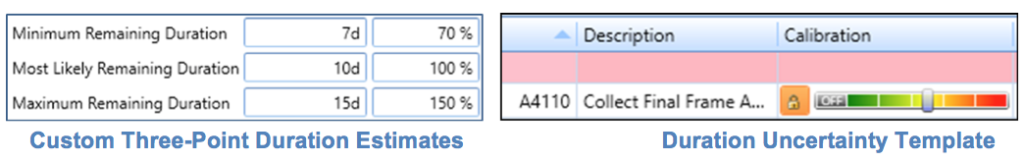
The preferred and more precise method is to obtain three-point duration estimates (best case, worst case, and most likely) from the task owners. At a minimum, this should be performed on all critical and near-critical tasks (and driving and near-driving tasks supporting significant events). For larger schedule networks, it may not be reasonable to gather this type of information for every task. If custom three-point estimates are not available, templated duration uncertainty could be applied based on the type of work, the task owner, historical performance, or any other applicable task characteristic.
Acumen Risk handles both methods very easily. Custom three-point estimates can be entered for each task in days (or hours), or as a percentage of the current remaining duration of the task. Standard duration uncertainty templates are easily applied to a task by selecting the appropriate risk level on the calibration bar. To streamline the process, by setting the calibration at any summary level, the uncertainty template is cascaded down to all the “children” tasks.
Risk Events
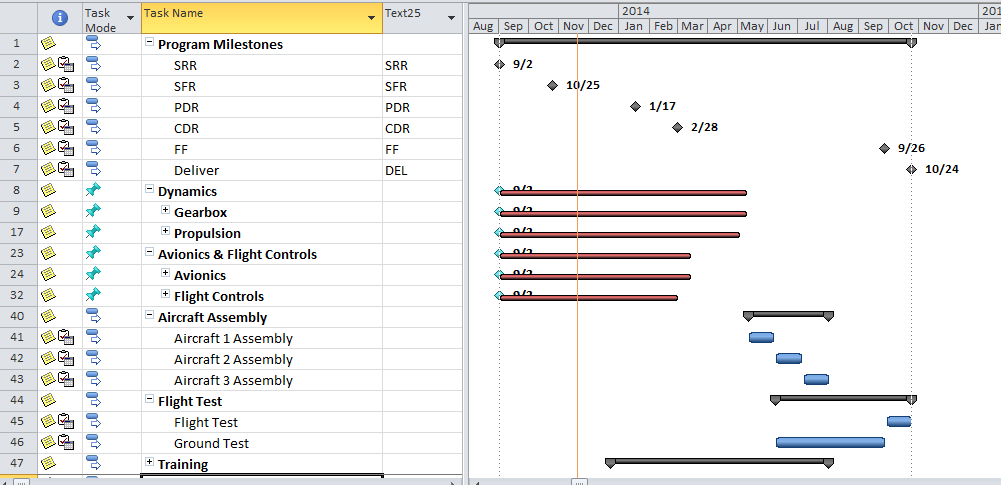
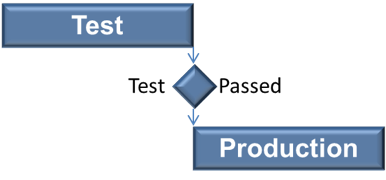
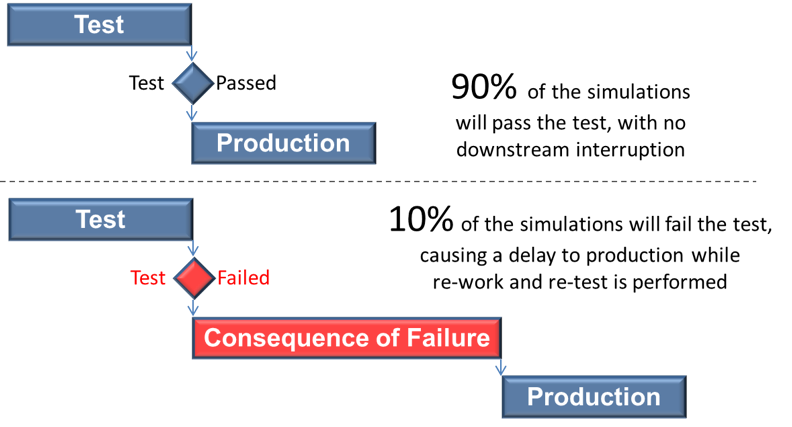
One thing traditional Critical Path Method (CPM) networks do poorly is model unexpected results. For example, if there is a 90% success rate on fatigue testing, the IMS will generally be constructed to assume the test will be successful, with no disruption to downstream tasks.
But what happens if the test fails? While unlikely, there is still a very real possibility that the results will be unfavorable. If the test does return unfavorable results, there will likely be a significant delay while re-work is performed in the areas of design, build and test. A traditional CPM network can model a successful test or an unsuccessful test, but not both. This is not a problem with a schedule risk assessment. Information from the project’s risk register can be used to model the likelihood of a test failure, as well as the consequence, or delay to downstream tasks resulting from that failure.
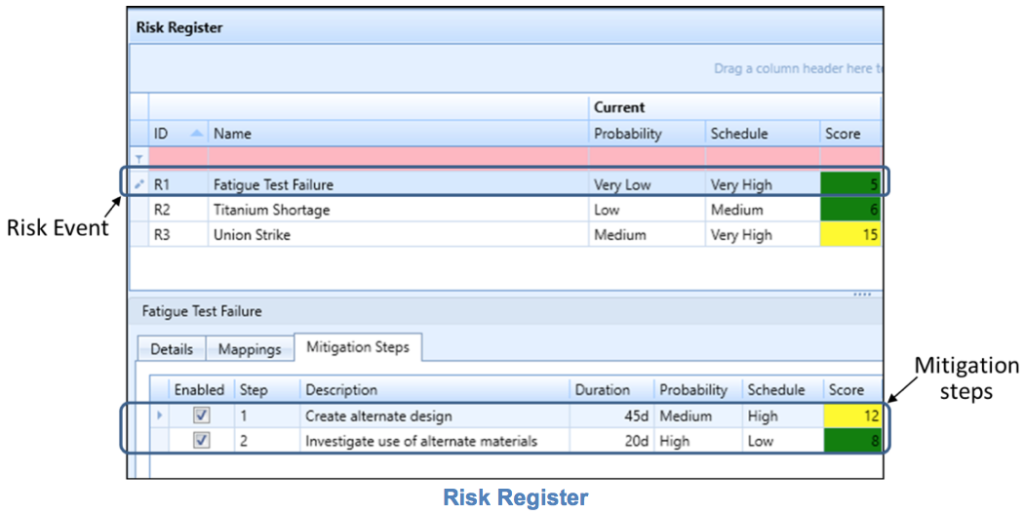
Is this an acceptable risk? An SRA can quantify the risk and provide information on the likelihood of successful deliveries. Acumen does not stop there though. One of its newest features is to organize and track all risk events within its built-in risk register, as well as to track the steps being taken to help mitigate that risk. Or, if your organization already maintains an external risk register in Excel, it can be imported into Acumen to eliminate the duplicate tracking of risk events. Whether the risk register is imported from Excel or built from scratch within Acumen, a single risk event can then be mapped to one or more activities, or a single activity can be associated with one or more risk events.
Simulation Process
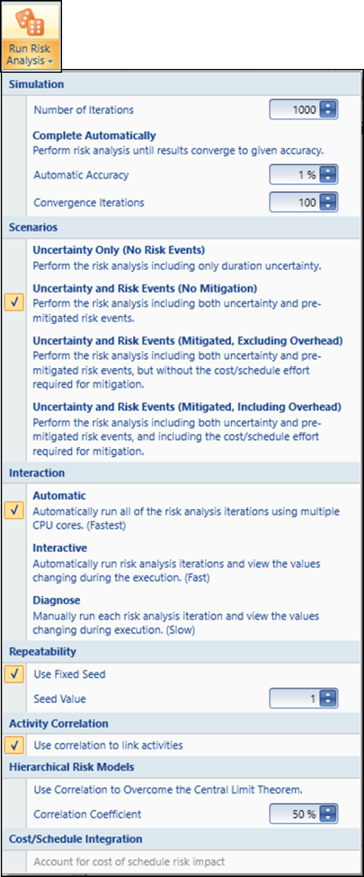
A typical SRA uses Monte Carlo techniques to simulate hundreds or thousands of potential project outcomes using the risks and uncertainties that have been supplied.
For most users, simply accepting the default settings and pushing the “Run Risk Analysis” button would be sufficient. But if terms like “Convergence”, “Correlation Coefficient”, “Central Limits Theorem” and “Seed Value” are part of your normal working environment, Acumen provides a variety of settings that can be customized to tune the SRA to best model your project.
No matter which approach you take, the Acumen toolset provides a quick and easy simulation process.
What to Expect in Part 2
Part 2 of this blog will delve into the interpretation of SRA results.
Yancy Qualls, PSP
Engagement Director, Schedule Subject Matter Expert (SME)
Humphreys & Associates, Inc.
Assessing Schedule Risk Using Deltek’s Acumen Risk 6.1 | Part 1 of 2 Read Post »

 example #1")
 example #2")
 example #3")
 example #4")
 example #5")
 example #6")
 example #6 details")