For decades government EVM project managers performed the task of integration of all prime and subcontractor performance and the associated data on a project. In the late 1960s things changed. The U.S. Federal Government mandated that the prime contractor become the integrator of the performance and the data. Many contractors undertook this responsibility nicely. However, for many contractors in this new role their subcontract management expertise and data accumulation capabilities were lacking on large R&D, SDD, and LRIP subcontract efforts in particular. The primes needed to include all of the data from their subcontractors that comprised as much as 80% of the contract effort. The timing of subcontractor reports became very important. However, software was “what it was” in the 1960s and ‘70s, and many EVM subcontractors were unable to meet the required delivery dates.
In the early 1980s the National Security Industrial Association [now the NDIA] conducted a survey and found that 40% of the subcontractor data was delayed by a month [additional reference, 2008 – NDIA.org source]. Consequently, January data from subcontractors would not be entered into the prime contractor’s performance reports [now IPMR or CPR] until the prime’s February report which may be delivered around 15 March. Today’s software has improved extensively and many EVM subcontractors recognize the importance of timeliness of data; they are also prime contractors on other EVM projects.
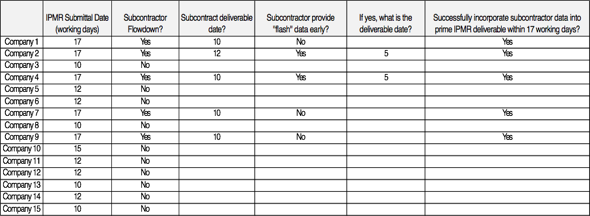
Many companies have not yet begun delivering performance data using the new Integrated Program Management Report (IPMR). Companies that are using the IPMR appear to be adapting well to the new requirements, specifically in regards to the submission date and successful retrieval of subcontractor data. The new IPMR Data Item Description, DI-MGMT-81861, specifically requires that “Formats 1-6 shall be submitted to the procuring activity no later than 12 working days following the contractor’s accounting period cutoff date. This requirement may be tailored through contract negotiations to allow submission as late as 17 working days, provided the contractor and Government agree that contract complexity and/or integration of subcontractor and vendor performance data warrant additional time and will yield more accurate performance.”
The table below illustrates the results of a survey H&A conducted of fifteen major contractors. While the sample size is small, the survey found that five prime contractors had an IPMR requirement flowdown to a subcontractor with NTE 12 working days submission CDRL requirement. In all five cases, the prime contractors were able to successfully incorporate subcontract data in time to meet the submission requirement.
While it has taken over 40 years, it is now recognized by both the government and contractors that timely incorporation of subcontractor performance data in the prime’s performance report helps validate the project data–the purpose of early visibility and prompt decision making.
Our survey found that those contractors submitting the IPMR are successfully incorporating subcontractors’ performance data in their IPMRs as the DID Instructions stipulate. It is hoped that the era of the “one-month lag” with subcontractor performance data has ended; and the government will be receiving accurate, timely IPMR performance data from its prime contractors.
Have you been in a meeting when presenters show differing To-Complete Performance Index (TCPI) values at the total contract level for the same contract? In these situations, the presenters have made different assumptions about the inclusion of Undistributed Budget and Management Reserve (MR) in the TCPI calculations. So let’s use some sample values and show different ways the TCPI can be calculated at the total contract level.
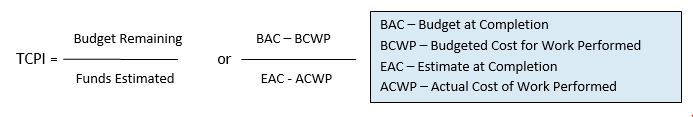
As a reminder, this is the formula for TCPI:
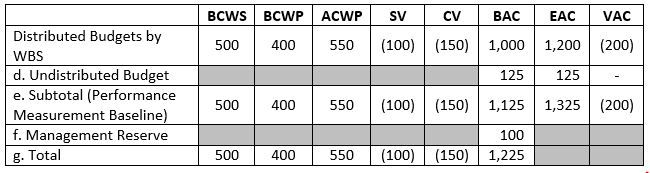
Consider the following extract from the lower right portion of Format 1 of the Integrated Program Management Report (IPMR) (Contract Performance Report (CPR)).
When comparing the TCPI to the CPI at the total contract level, the most realistic approach is to calculate the TCPI at the level of the Distributed Budgets. Stated differently, the TCPI should be calculated without Undistributed Budget and Management Reserve. The Cost Performance Index (CPI), BCWP divided by ACWP, represents the cost efficiency for the work performed to date. Notice in the above table that the BCWP and ACWP values in the rows for “Distributed Budgets by WBS”, “Subtotal”, and “Total” are the same; therefore, the CPI calculation will be the same for any of these data levels. The TCPI represents the cost efficiency necessary to achieve the reported EAC. The “Distributed Budgets by WBS” contain approved budgets as well as performance data against those budgets. The CPI and TCPI compared at this level of data certainly provide a valid comparison of past performance to projected performance. The CPI for the above data is 0.73 while the TCPI is .92.
Since the difference between the CPI and TCPI is greater than 0.10, the control account managers (CAMs) and the analysts should research the reasons that the future performance indicates improvement and provide EAC rationale.
Calculating the TCPI at the Performance Measurement Baseline level (i.e. including Undistributed Budget in the BAC and EAC) yields a different TCPI than at the Distributed Budget level. Mathemati-cally, the TCPI will be the same for the Distributed Budgets and PMB only if the value of the Estimate to Complete (EAC – ACWP) equals the budgeted value of the remaining work (BAC – BCWP). In that case, the TCPI will be 1.0. If the contract has an unfavorable cost variance and projects an overrun on future work, the TCPI at the PMB level (includes UB) will be higher than the TCPI calculated at the Distributed Budget level (does not include UB).
For the data in the above table, the Distributed Budget TCPI = 0.92 but increases to 0.94 if Undistributed Budget is included in the calculation. The Undistributed Budget, with the same value added to both BAC and EAC, represents a portion of the Estimate to Complete (ETC) that will be performed at an efficiency of 1.0. In an overrun situation at the distributed budget level, the disparity between the CPI and TCPI increases when Undistributed Budget is included in the TCPI because more work must be accomplished at a better efficiency to achieve the EAC. In the above data, the disparity between CPI and TCPI increased from 0.19 to 0.21.
Calculating the TCPI at the total contract level with Undistributed Budget and Management Reserve in both the BAC and EAC yields TCPI values very close to TCPI values calculated at the distributed PMB level. The UB and MR values included in the BAC and EAC increase the proportion of the remain-ing work that is forecast to be completed at an efficiency of 1.0 and push the TCPI toward the 1.0 val-ue. The larger the values of UB and MR, the more the TCPI will diverge from the TCPI calculated at the Distributed Budgets level. Using this approach for the sample data above, the CPI is 0.73 and the TCPI is 0.94.
Calculating the TCPI at the total contract level, but not including Management Reserve in the EAC, creates a significant disparity between the CPI and TCPI. This situation represents the classic “apples to oranges” comparison: the work remaining in the formula includes MR, but the funds estimated do not. Obviously, with a higher numerator, the TCPI would be higher than any of the other approaches discussed above. Using this approach for the sample data above, the CPI is 0.73 and the TCPI is 1.06. While situations arise where exclusion of MR from the EAC makes sense, it is still important to review the project manager’s rationale with respect to MR application. Most situations assume that MR will be depleted during contract performance; consequently, it should be added to the EAC at the PMB level.
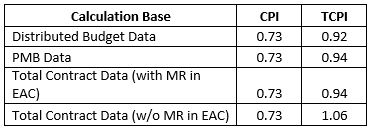
In summary, be sure you understand what is included in the TCPI calculation before you make comparisons to the CPI at the total contract level. The following table summarizes the CPI and TCPI for the sample data in this article and highlights the differences in the TCPI when calculated at the various data summary levels.
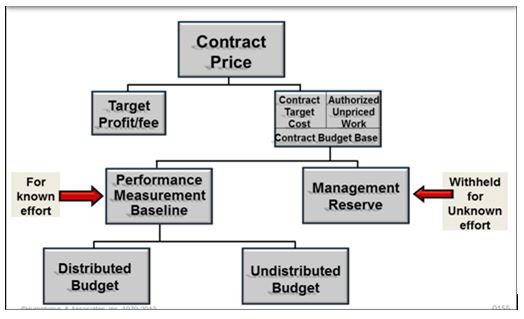
For projects, the moment the baseline is established it is subject to change and a disciplined approach in the change process must be in effect. The source of project changes can be either external or internal. External changes frequently affect all aspects of a contractor’s internal planning and control system and are generally for effort that is out-of-scope to the contract. Contract changes impact the Contract Budget Base (CBB) and are distributed to the Performance Measurement Baseline (PMB), which includes the distributed budgets containing control accounts, and Summary Level Planning Packages, and to the Undistributed Budget.
These changes may also impact the Management Reserve (MR) budget if the decision were made to withhold reserve from the budget for the change. The Work Breakdown Structure (WBS) serves as the framework for integrating changes within the project’s structure. Internal changes operate much the same, but they do not change the CBB. The most common reasons for internal changes are the allocation of MR for contractually in-scope effort, replanning of future work, and converting planning packages to work packages.
The Earned Value Management Systems Guidelines require that all changes, regardless of the source, be incorporated in a timely and disciplined manner. Consequently, the project needs to have a formal change process and procedures in place. Following these processes and procedures will also help minimize disruptions in the current effort while changes are being incorporated. An undisciplined change control process has the potential to create timing or quality issues that will lessen the baseline’s effectiveness as a management tool.
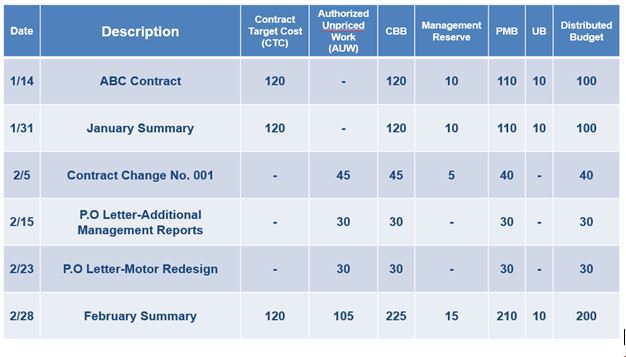
Baseline changes must also be tracked to ensure baseline integrity. The most effective way to do this is to establish baseline logs to track all approved changes. These can include the Contract Budget Base (CBB) Log, as shown below, the Management Reserve (MR) Log, and the Undistributed Budget (UB) Log. In addition, a log may be established to track all approved, unapproved and unresolved change requests.
Once established, these logs must be maintained and reconciled to the data reported in the Integrated Program Management Report (or Contract Performance Report) that is delivered to the customer on a monthly basis. This reconciliation helps validate that the PMB accurately represents the project’s technical plans and requirements.
One of the most important items needed to prepare for an Earned Value Management System (EVMS) review is the data call. This is not just a list of random data; the reviewing authorities have a defined set of data items they want to review so they can evaluate the EVMS implementation and compliance.
Required Artifacts
Over the years the reviewing authorities have fine-tuned the review process and created a very specific list of required artifacts. They use these items to pre-determine the review focus areas so they are prepared to get right to the soft spots in the system and processes.
Formal Review Notification
The process begins when the contractor receives a notification from the reviewing authority that they will conduct a formal review of a project. This could be a Compliance Review (CR); an Integrated Baseline Review (IBR); standard Surveillance; or one of many other reviews conducted to determine the implementation or continued compliance of the EVMS processes and reports. Regardless of the type of review, one of the key items is the data call request. The data call is used to request project information, and could consist of 12 reporting periods, or more, of data. This will vary by agency, type of program, and type of review. In most cases, a minimum of three months of project data will be required; typically, however, 6 to 12 months of data would be requested.
Basic Reports
Some of the basic reports requested are the Contract Performance Reports (CPRs), Integrated Program Management Reports (IPMRs), or similar time phased project performance reports produced from the earned value (EV) cost tool database. The data call request includes the detail source data from the EV cost tool as well as the Integrated Master Schedule (IMS) from the beginning of the program. This source data is often delivered electronically to a customer following the IPMR or Integrated Program Management Data and Analysis Report (IPMDAR) Data Item Description (DID) prescribed data formats. The Baseline Logs are often also requested.
Quality Data
It is essential to provide quality data in response to the Review Authority data call. The entire review process can be derailed when data call items are incomplete or inaccurate. Some of the things to consider are:
Make sure the list of requested items is fully understood (some nomenclature issues could cause an issue).
The data should be available in the format required in the call.
Determine the best way to support the data call delivery if it is not specified in the request. The data can be provided using electronic media such as thumb drive, as attachments to emails (the size of the files may prohibit this), or possibly establishing a secure access cloud server to store the data for the reviewing authority to retrieve.
Contact the requesting reviewing authority to establish a meeting to discuss the data call. This meeting should be used to resolve or clarify any issues regarding the requested information, negotiate potential equivalents of the project data if it does not exactly match the requested information, and establish a method to transmit all data files.
Develop an internal plan to monitor the progress of data collection. Be sure to have non-project personnel review the data for accuracy and compliance with the specifics in the data call.
Submit the data call to the requesting authority, follow-up with a phone call or meeting to verify the reviewing authority received the data, can open all the files, and agrees the complete set of data has been provided.
Follow-up with another call a few weeks before the review to check if the reviewing authority has any issues or problems in evaluating and understanding the data call information. Be willing to work with them until the authority is comfortable with the data.
[NOTE: The number of items on the list depends on (1) the agency conducting the review and on (2) the type of review being conducted. The number of items requested could vary from around 30 to 100 or more.]
Typical Data Call
Some of the basic items typically requested in the data call are:
Earned Value Management System Description including the matrix of the System Description and related system documentation mapped to the 32 guidelines in the EIA-748 Standard for Earned Value Management Systems as well as to the current version of the reviewing agency’s EVMS Cross Reference Checklist.
EVMS related policies, processes, procedures, and desktop instructions. Examples include organizing the work, scheduling, budgeting, work authorization, details about earned value techniques and how each is applied, change control, material planning and control, subcontract management, and risk/opportunity management.
Organization charts down to the Control Account Manager (CAM) level.
Accounting calendar.
Project directives including the Statement of Work (SOW) pertaining to Program Management or Statement of Objectives (SOO), EVM clauses, and EVM Contract Data Requirements List (CDRLs) or Subcontract Data Requirements List (SDRLs).
Work Breakdown Structure (WBS) Index and Dictionary.
Project and internal work authorization documents.
Integrated Master Plan (IMP) or milestone dictionary.
Contract Budget Base Log, Management Reserve Log, and Undistributed Budget Log.
Risk/opportunity identification and assessments, risk/opportunity management plan.
Cost performance reports (all applicable formats) or datasets. Provide the reports or dataset in the format provided to the customer such as PDF, Excel, UN/CEFACT XML, or JSON encoded data per the DID on contract such as the CPR, IPMR, or IPMDAR.
Integrated Master Schedule (IMS) submissions and related native schedule file. This includes the IMS summary report if required.
IMS Data Dictionary.
Most recent Contract Funds Status Report (CFSR) or equivalent funding status report.
Variance Analysis Reports (VARs) or equivalent progress narrative reports as well as the internal and external variance thresholds.
List of subcontractors including value and type (such as cost reimbursable, firm fixed price, time and materials) including the applicable purchase orders. When EVM requirements are flowed down to the subcontractors, provide a copy of subcontractor EVM related contractual requirements (CDRLs and DIDs).
Major subcontractor CPRs, IPMRs, or equivalent cost performance reports (all applicable formats) or IPMDAR datasets.
Major subcontractor IMS submissions.
Previous audit or surveillance findings, resulting reports, corrective action plans, and resolution and tracking Logs.
List of specific software toolsets used for accounting, scheduling, cost management, resource management, risk/opportunity management, or performance analysis.
Any other data previously provided to the customer as part of a data call.
Basis of Estimates (BOE) or historical data/productivity rates and efficiency factors.
Estimate to Complete (ETC) and Estimate at Completion (EAC) documentation.
Budget reports or control account plans by element of cost (labor hours and dollars, material dollars, and other direct cost dollars) and associated burdens or overhead costs.
Actual cost reports.
Open commitment reports.
Bill of material including cost detail.
Quantifiable Backup Data for percent complete work packages including MRP/ERP Reports for production work packages.
Reacquaint Yourself
The list includes items that are used frequently, as well as items that are used only at specific times during the project, and will probably be less familiar to the review team. As the collection of the data call items progresses, be sure to establish quick refresher sessions on the less frequently used documents and any other items where the review team might be having difficulty. As part of the process of gathering the data call items, be sure internal reviews are conducted to verify accuracy and traceability, verify the users of the data are familiar with the data content so they can be prepared to answer questions, and current data are available to the review team.
NOTE: This Data Call List is intended for general guidance in preparation for any agency review (e.g., DCMA, DOE, FAA, etc.). For example, in the past, the DCMA Compliance Review Data Call item list contained 102 specific items, but this number varies from review to review and has changed over the years. The number is not as important as the quality of the data items that are delivered to the review authority.
First Impressions
The data call items will provide the first look at the project’s EVM data and process for many of the review team members. The review team members will have the data several weeks prior to the on-site review. They will be performing multiple validation checks using various analytical software tools as well as hands-on analysis of the information. If the data is incomplete, contains errors, and does not trace well, the review team will form a more negative opinion of the EVMS application.
Double Check the Data Call
The data analysis results will be a basis for where attention is focused during the on-site review, as it emphasizes areas that contain anomalies or indicates a lack of system integrity. Significant emphasis should be devoted to the data call items to ensure accuracy and compliance with the review authority’s requests, as it is a very positive way to begin the data call review.
A Humphreys & Associates EVM specialist is always available to answer questions. Give us a call or send an email.
Methodology for Top Level Program Schedule Road-Mapping
The lack of a useful, concise, easily understood top level plan for a project is an issue that our consultants have repeatedly noted. It is way past time for the adoption of more useful and understandable executive level schedules. Having a distinctive top level plan linked to the lower level Integrated Master Schedule (IMS) planning can help differentiate one approach or one project from another.
With the advent of modern scheduling software such as Microsoft Project or Primavera, we have been assisting clients in developing more and more complex Integrated Master Schedules. However, a bigger and more complex IMS does not make the project plan any more accessible or understandable. In fact, it makes having an attractive and useful top level schedule more important.
The Data Item Description (DID) that governs the IMS, the Integrated Program Management Report (IPMR) DI-MGMT-81861, requires a Summary Master Schedule and describes it as:
3.7.1.3.2 Summary Master Schedule. A top-level schedule of key tasks/activities and milestones at the summary level which can be sorted by either the Work Breakdown Structure (WBS) or IMP structure (if applicable). It shall be a vertically integrated roll up of the intermediate and detailed levels within the IMS.
The Planning & Scheduling Excellence Guide (PASEG) developed by the NDIA Program Management Systems Committee is a wonderful resource for schedulers. The guide discusses the Summary Master Schedule in a way that avoids specifying it is to be sorted either by WBS or by Integrated Master Plan (IMP) the way the data item description does. It also does not describe the top level as a roll up. The PASEG describes the Summary Master Schedule as:
Summary Master Schedule – The Summary Master Schedule is ideally a one (1)-page schedule and may also be called a Master Phasing Schedule (MPS), Master Plan or Summary Schedule. As the highest, least detailed schedule, the program’s summary master schedule highlights the contract period of performance, program milestones, and other significant, measurable program events and phases.
The Program Team initially develops the program summary master schedule from the analysis of requirements data during the pre-proposal phase and similar past program efforts. The program team review and approve the program’s top-level schedule, which serves as a starting point in the Top Down planning approach (See Top Down vs. Bottom up Planning). This process continues until contract award to include any changes caused by contract negotiations.
Key components of summary master schedules could include significant items from the following list:
Key elements of contract work
Test articles
Deliverable hardware, software, and documentation
GFE/customer-furnished equipment deliveries
Key program and customer milestones/events over the life of the contract
Subcontract elements
The PASEG further describes the process for developing the Summary Schedule. H&A agrees that this process is the effective one for creating an executable plan. The process makes the top level summary schedule even more important. The process outlined by the PASEG is:
Read and understand the RFP.
Make a high level plan to meet the requirements of the RFP.
Use the high level plan to guide the top-down development of the IMS. This includes building the milestones that represent the Integrated Master Plan (IMP) events, accomplishments, and criteria.
Validate lower level planning back against the top down plan.
In addition to the Data Item Description and the PASEG, H&A suggests that the Summary Schedule have some specific attributes that make it useful. It should be:
Complete – show the key milestones and the entire project top to bottom and across time at a level of condensation that makes sense and is natural to the project.
Easy to read – graphically it should portray the plan in a visually pleasing way that is easy to read.
Easy to follow – flowing from left to right and top to bottom in a sequence that follows the progression of the work of the project.
Self-explanatory – it should tell the story of the project even if adding notes are needed to make the story stand out.
Because the graphics in the IMS tools do not provide those attributes, H&A most often sees clients building some sort of “cartoon” plan, manually drawn in Excel or PowerPoint, and used during the proposal phase until the IMS can be considered solid enough to start using the roll up in the IMS as a Summary Schedule. The problem with this approach is that it is not linked electronically to the IMS; it is not part of the IMS and the data in the two can easily become different.
The maintenance of the cartoon version is continued in some cases or abandoned. When it is continued it involves labor effort to draw and redraw the plan based on changes and updates. Often the cartoon is abandoned and the roll up approach from the IMS tool takes over. At this point the top level executive type schedule no longer exists and the project plan is no longer readily accessible.
One of the main benefits of having an executive level summary schedule is that the program manager and team can easily tell the story of the project in a one page, coherent, easily understandable plan; and with the proposed methodology this summary schedule is linked to the IMS so the two do not become separated.
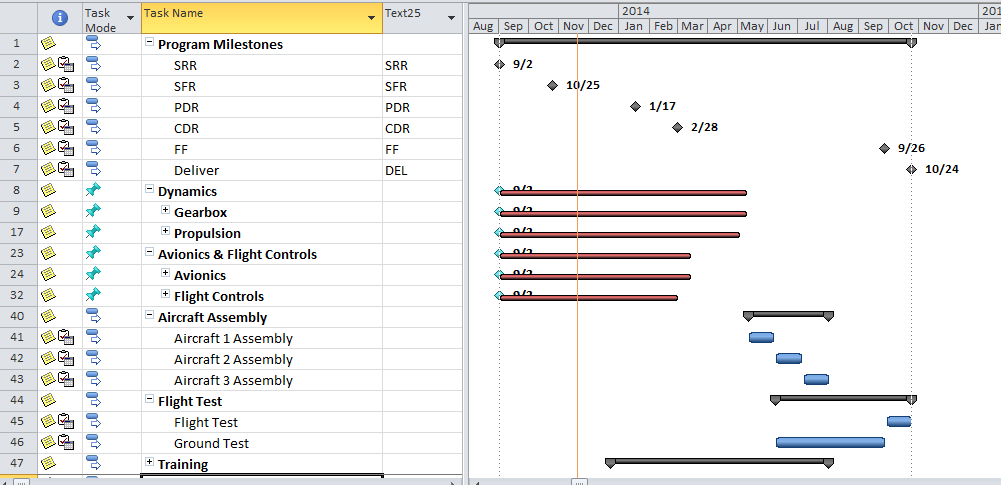
Looking at the two examples of a master schedule for the same project shown below, it is apparent that the first one is from Microsoft Project; it has the roll up look and feel to it. The summary bars do not really provide much information other than to indicate there is more information below.
The other example from the H&A methodology is a top level schedule that tells the story of the project in a form that flows the way the project does. It may be in WBS or OBS order but those may not be natural to the flow of the project. This example is grouped in the order that displays the evolution of the project the way the team thinks of the project. The tie to the underlying IMS is built into the plan. Each milestone or bar on the top level represents one or more tasks within the IMS so a user can find the identification of the corresponding work in the depths of the IMS when needed.
Click image to enlargeHumphreys & Associates Road Map Chart – click image to enlarge
H&A now has developed a methodology supported by commercially available software that follows the guidance of the NDIA Planning & Scheduling Excellence Guide (PASEG) and provides the ease of use and executive level visibility needed in a top level schedule. Now a project can have a useful and demonstrative top level schedule that drives the top down planning effort as recommended in the PASEG.
This methodology was recently used successfully in the aerospace industry to develop the top level executive schedule view that drove the planning of a proposed multi-billion dollar project and to tell the story of the proposed project convincingly. The benefits perceived in that instance were:
Enhanced communication with the customer – the story could readily be told on one page.
Enhanced communication with company executives – they could easily see what was being planned by the proposal team.
Top down planning from the proposal leadership into the Integrated Product Teams (IPTs) early in the proposal process when it counted most and kept all the teams focused on the same plan – everyone knew the plan.
Establishment of the System Engineering approach and the Technical/Program reviews as the key points in the plan.
Top down electronically linked planning into the Integrated Master Schedule (IMS) so that the development of the 5000 line proposed project schedule could be compared upward to constantly verify that the developing plan would support the top level plan.
Establishment of time-fences that alert proposal leadership when lower level plans were moving away from established time goals.
Rapid effective translation of the developing IMS into the understandable project plan – especially useful in planning meetings within the proposal teams.
Because the top level is linked to the lower level, it can be used in meetings to rapidly isolate and find sections of the lower level IMS relating to a particular topic – no more paging, filtering, and searching for a particular area of the project’s IMS.
Proposal quality graphics that did not require artists or artwork to tell the story.
To learn more about the H&A top level project road-map methodology and other EVMS topics, visit our website or call us to discuss your project.
A healthy part of any system, including an Earned Value Management System (EVMS), is regular review and surveillance by both those who operate within the system (the contractor) and those customers who rely on information from the system to manage programs. The DCMA and the DCAA have the responsibility to conduct surveillance for all Department of Defense (DoD) contract efforts that require Earned Value regardless of whether a validated system is required. Similar guidelines exist for those agencies that do not use the DCMA for surveillance, such as the Department of Energy.
In addition, other reviews such as an Integrated Baseline Review (IBR) or technical program reviews are also conducted during the life cycle of most programs. Normal results of system surveillance and program reviews are findings or issues discovered during the review. The findings are usually documented in Corrective Action Requests (CARs) and Discrepancy Reports (DRs). Often, the DR form is used to identify the finding, which is delivered to the contractor in the CAR form.
The current guidance used by the DCMA for conducting surveillance is the Standard Surveillance Instruction (SSI), which can be found on the DCMA Guidebook. In addition to system surveillance, the DCMA EVM Center conducts Compliance or Validation reviews that may result in corrective actions required by the contractor. Currently the DCMA is evolving its approach to the compliance evaluation of DoD contractor systems. Because of a desire to standardize across its reviewing organizations and the reduction in resources available to conduct on-site reviews, the DCMA is transitioning to establishing predefined success criteria and testing methods to evaluate the compliance of each guideline using data submitted by the contractor.
This does not change the components of a compliant EVMS; it merely adjusts the priority of the review steps required for a compliance rating. Regardless of the method, a complete EVMS should consist of:
A set of procedures that are compliant with the EIA-748 Guidelines and followed by the contractor organization;
System output, or data, that is valid, reliable, and auditable. This data will have demonstrable integrity and compliance to EVM requirements;
A disciplined work force that uses the EVMS to manage programs and accurately inform the customers of current status, future conditions, and management decisions.
Discrepancy Reports are documented whenever issues are discovered during the system review that involve non-compliance with contract requirements, including the EIA-748 and the Data Item Descriptions (DID) for the Contract Performance Report (CPR) or the Integrated Project Management Report (IPMR), or the Integrated Master Schedule (IMS). The finding is documented in a Discrepancy Report (DR), which identifies the EVM Process Group (Organizing, Scheduling, Accounting, etc.) and the specific guideline regarding the finding. Additional information might include the source of the issue such as the CAM name, Control Account title, or the process document that was reviewed. The DR may also include attachments or exhibits which provide examples of the discrepancies.
The DCMA, or the DCAA, may choose to communicate the DRs in the form of a CAR. The severity of the findings determines the level of the CAR issued:
Level 1: For more minor issues that require no special management attention to correct. Usually directed to the working level personnel of the contractor.
Level II: For non-compliance that is systemic in nature and could adversely impact cost, schedule, or performance if not corrected. A Level II CAR may be the result of Level I issues that are found across several programs or involve several CAMs. They are issued to the contractor’s management level responsible for the process with a copy to the Administrative Contracting Officer (ACO).
Level III: For non-compliance where cost, schedule, technical performance, resources, or management process issues have unfavorably affected program performance and have not been corrected. These may also be issued when the Corrective Action Plans associated with Level II CARs have been unsuccessful. In addition, noncompliance with any of the sixteen foundational guidelines will immediately be classified as a Level III CAR. Level III CARs are issued to the contractor’s top tier business manager at the site where the discrepancies were noted. This CAR level may trigger other reviews such as a review for cause or a compliance review, which could result in a suspension of the contractor’s EVMS validation.
Level IV: Generally results from an escalation of a Level III CAR, but issued to the contractor’s corporate level. They are often used to advise the contractor of contractual penalties; such as payment withholds, termination for default, suspension, etc.
Both Level III and IV CARs may result in a “business system” withhold. DFARs 252.242-7005* identifies 6 business systems that may result in payment withholds if significant deficiencies are found, these are: Accounting, Earned Value Management, Cost Estimating, Material Management and Accounting, Property Management, and Purchasing. Deficiencies found in a single business system may result in up to a 5% withhold; however, if there are multiple business systems cited for deficiencies the withholds may be as much as 10%.
At this point, the submittal of a quality and timely Corrective Action Plan (CAP), and following through with implementation of the actions is critical. If the contractor submits an acceptable CAP within 45 days of the Contracting Officer’s (CO) intent to withhold payments, and the CO believes the contractor is implementing the plan, the withholds may be reduced to 2%. However, if at any time the CO determines that the contractor is not following through on the corrective actions, the payments may be increased to 5%.
When the CO determines that corrective actions are implemented and are expected to correct the significant deficiencies, the CO will discontinue withholding payments and release any payments previously withheld. Previously withheld payments are not released when the withhold is reduced from 5% to 2%; only when the corrective actions are proven to correct the findings.