“Data! Data! Data!” he cried impatiently. “I can’t make bricks without clay.”
-Sherlock Holmes, The Adventure of the Copper Beeches
There are many discussions about EACs and evaluating EACs including using Independent EAC (IEAC) formulae to compare with the contractor EACs. With good reason, we should wonder how accurate are those IEACs that we use so often and sometimes make decisions based on them. Are we misjudging contractor’s EACs based on formulae that are weak or inappropriate?
Humphreys & Associates has initiated a study to determine how accurate IEACs are, and we would like your help. The study will compare different IEAC formulae against the Program Manager (PM) most likely EAC at the 25, 50, and 75 percent complete point for completed projects. The objective is to assess how closely the IEACs and PM most likely EAC were able to predict the final cost outcome for the project.
How Accurate are IEAC Formulae?
Many formulae exist for using recorded data from an earned value management system (EVMS) to make independent estimates of the final cost at completion (EAC) for the element in question. The element might be a control account, a Work Breakdown Structure (WBS) element, or even an entire project.
What is not known is how accurate these methods are at forecasting the final actual cost for the project. This study hopes to determine that answer.
Real World IEAC Data
This study was initiated by collecting earned value data from 12 completed projects. We need projects that are completed because, on a completed project, the final actual outcome is known. We collected project data at the 25, 50, and 75 percent complete points. At each of these points, the IEAC formulae were applied to determine how closely they were able to predict the final actual cost outcome for the project. The quest is to learn how the various IEACs performed. Is any one of them more accurate than the others?
From this investigation, any indication of the relative efficacy of the formulae would be used to inform future use of the IEAC methods.
Our Method for Testing IEACs
In general, the IEAC approach is to use existing recognized formulae. We have chosen these IEACs as a starting point:
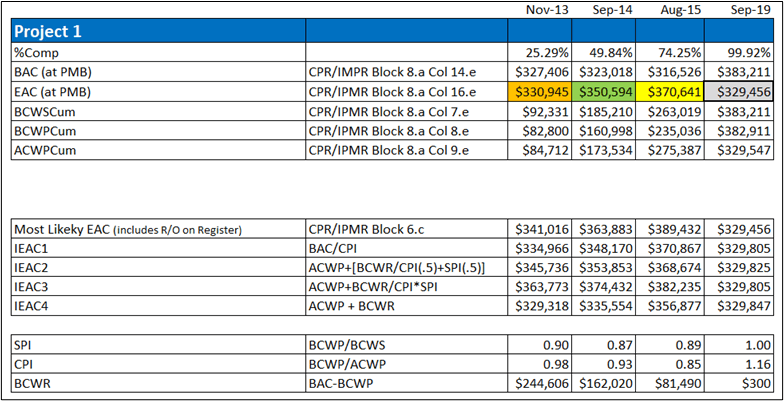
- IEAC 1 = BAC/CPIe at the percent point reported. This formula can be stated in words as “the entire project is performed at the same efficiency as experience to date.”
- IEAC 2 = ACWP + [BCWR/CPI (.5) + SPI (.5)]. This formula uses weighted SPI and CPI which theoretically allows for sensitivity to both cost and schedule historical performance. The weights used in this application are even at .50 and .50.
- IEAC 3 = ACWP + [BCWR/CPI x SPI]. This formula uses the SPI and CPI multiplied together which theoretically allows for sensitivity to both cost and schedule performance to date.
- IEAC 4 = ACWP + BCWR. This formula assumes the remaining work will be done as budgeted with no factoring.
One additional non-traditional IEAC will be used.
IEAC 5 = Use of IEAC 2 weighted SPI and CPI but decreasing the proportion applied to the SPI as the percent of project completion increases. In other words, the impact of schedule performance diminishes as the project becomes closer to completion.
We will also take the average of all the formulae to see how that works.
Initial Data Set
One aerospace contractor and one US Government agency have provided the required data for 12 completed projects with an interest in the outcome of the study. The source of the data and the specific projects will not be disclosed in the study.
These real-world projects did not have an exact 25%, 50%, or 75% dataset. The closest dataset to each of those completion percentages was used. One example dataset looks like this (color coding should be ignored):
How can you help?
We need more project data to gather enough varying project outcomes to make the test realistic. We do not plan to keep the types of projects or products separate but will take all the data we can get and look at them all.
Please consider providing data for the study. We have created an Excel spreadsheet template to help gather project data in a common format for analysis. You can download this template here. Add as many tabs as needed for each project. Send your completed spreadsheet to humphreys@humphreys-assoc.com.
In a separate blog we will outline other help we need to complete the study and to analyze the results.
A word re your IEAC study… another term to consider is SFP – Self Fulfilling Prophecy. As the senior OSD analyst 1982-99, I independently reviewed hundreds of contractor and PM EACs reported by the military departments.
The typical spread was – contractor’s EAC was lower than PM’s, which in turn was often lower than mine.
I stopped the practice of analyzing the contractor’s EAC (or Latest Revised Estimate – LRE – a useless term). Why? Because EACs become SFPs. The only EAC that matters to the chain of command is the PM’s. I learned early that reports are at core an essential form of communication, not an invitation to audit. PMs and their contractors had to have both formal and informal communications. My role was to hold the PM accountable for reporting upstream – not to second-guess his/her contract management.
Please consider this in your study. Too many EVM “auditors” think of EACs as a mechanistic process, forgetting it’s an estimate.
One thing for sure – Christensen’s research showing that CPI Cum establishes a floor hasn’t been disproved (except by the flawed analysis by the ES advocates).
Hi Gary,
Really great to see you supporting this research. We need to do more of this.
FWIW, we in the private sector have identified and been using not 4 forecasting methods but 8, and with the proliferation of AI, we suspect this will only INCREASE.
Here is a paper from one of our top graduates, Stephen Paterson, Project Controls Manager with Exxon-Mobil Singapore showing the 8 methods we have been using. https://pmworldlibrary.net/wp-content/uploads/2018/01/pmwj66-Jan2018-Paterson-comparison-of-8-common-forecasting-methods-featured-paper.pdf
I have also passed along this blog to Steve as he may be able to share more real data from Exxon-Mobil.
I have also passed this link along to our current AACE Certification program from Pertamina, as they, too, may be interested in sharing real information from their oil and gas projects.
Another forecasting tool we have been experimenting with for some time now is the use of Excel’s “Add Trendline” feature to forecast both BCWP and ACWP as well as to forecast the SPI and CPI.
Go here https://pmworldlibrary.net/wp-content/uploads/2023/09/pmwj133-Sep2023-Giammalvo-futility-of-master-plans-prepared-with-little-or-no-hands-on-experience.pdf to Figure 17 and you can see an example of how we are using the “Add Trendline” feature in Excel to forecast the combined impact of CPI and SPI.
And if you visit this paper, https://pmworldlibrary.net/wp-content/uploads/2023/04/pmwj128-Apr2023-Giammalvo-Applied-Earned-Value-Management-based-on-Cost-Engineering-Principles.pdf and scroll down to Figures 11 and 14,
you can see examples where we have applied the “Add Trendline” feature from Excel to forecast the ACWP and BCWP values.
Thanks again for taking up this research project and we will be happy to do as much as we can to support your efforts.
Pingback: Incorporating IMS Information Directly into Independent Estimate at Completion (IEAC) Formulas - Humphreys & Associates