The August 2026 NDIA IPMD forum emphasized using Earned Value Management Systems (EVMS) as an early-warning system that helps management identify risks, make timely decisions, and protect project outcomes.
Forum discussions included integrating subcontractor schedules into the Integrated Master Schedule (IMS), improving Schedule Risk Assessments (SRAs), maintaining credible Estimates at Completion (EACs) and forecast completion dates, and proactively managing Level of Effort (LOE).
The NDIA IPMD Clearinghouse Committee provides a forum for industry and government EVMS practitioners to discuss challenges and develop mutually acceptable solutions. H&A actively participates in these forums and provides related guidance through our blogs and articles.
H&A earned value consultants routinely attend and present at the NDIA Integrated Program Management Division (IPMD) forums that are held twice a year as well as serve on the IPMD Board of Directors. The IPMD forum presentations, discussions between industry and government customer representatives, and Clearinghouse Committee topics provide an opportunity to discuss current challenges and options for resolving them. If you are not familiar with the IPMD Clearinghouse Committee, a time slot on the agenda is reserved for this committee’s working session. Industry Earned Value Management System (EVMS) practitioners raise and discuss issues along with the government EVMS counterparts to develop mutually acceptable resolutions and/or recommendations. Issues raised during the Clearinghouse Committee sessions have often been the basis for launching many other IPMD committees such as the Planning and Scheduling Committee and Prime/Sub Committee.
In addition to EVMS related challenges that surface on recent H&A engagements, the H&A blogs and articles are often written to address common issues or general themes from these IPMD forums. The August 2026 forum was no different. What follows is a short list of discussion and presentation topics from the August 2026 forum with links to H&A blogs or articles that address these current issues and presentations.
The value of an EVMS. This was a general theme from three presenters that aligns with recent H&A EVMS Education Center articles including one titled “Ten Project Failure Risks: Using an EVMS to Improve Project Outcomes.” The purpose and value of an EVMS is often lost when the focus is on producing contractual reports or managing to a set of compliance metrics instead of using the data as an early alert system for emerging risks and issues. An EVMS provides management a disciplined way to understand the current status of a project and where it may be headed. Management must provide the response to the EVMS alert signals, make decisions, and take action while there is still time to protect project outcomes.
Approach for integrating subcontractor schedule data into a prime’s Integrated Master Schedule (IMS). There are often differing opinions from the contractor’s or the government customer’s point of view about how the IMS should be structured to include this data. The main goal is to determine a logical approach that does not overcomplicate the structure and content of the IMS that makes it difficult to maintain or compromises the overall purpose of an IMS. The H&A blog “Integrating Subcontractor Data into an Integrated Master Schedule” discusses this common challenge and risks when scheduling requirements are not clearly defined. It also discusses three approaches for incorporating subcontractor schedule data with pros and cons for each approach.
Schedule Risk Assessments (SRAs). The continuing discussions on SRAs often center around the quality of the SRA data and that it is being treated like a check the box exercise. The solution isn’t to require contractors to perform monthly SRAs. That fails to address the root cause: meaningless duration estimates. In some instances global factors are applied to existing duration estimates as a short-cut. Producing a useful SRA starts with a high-quality IMS along with a disciplined risk management process and focused analysis of selected tasks that have a high probability of impacting a major event or project completion date. The H&A blog “Maximizing the Value of Schedule Risk Assessments (SRAs)” provides suggestions on how to implement a straight-forward process that helps to produce a more realistic IMS.
Estimates at Completion (EACs). This is another continuing discussion between industry and their government customers about practices that help to ensure a contractor’s forecast completion date (FCD) and EAC are realistic. The H&A blog “Maintaining a Credible Estimate at Completion (EAC)” emphasizes the importance of realistic EACs and why it matters to all stakeholders. The blog discusses practices that can help to ensure EACs are actively maintained along with suggestions for practical process improvements including leveraging evolving tools and analytics.
Proactive management of Level of Effort (LOE). The LOE topic often comes up in the Clearinghouse working sessions. When the percentage of LOE work packages and their total budget value for a given project is low, some consider LOE to be a non-factor in the overall picture of project performance. However, that is not always the case. Selecting the LOE earned value method must be a conscious decision (not a planning short-cut) and actively managed to ensure the timing and duration as well as any relationship to discrete work packages remain valid. The H&A blog “Level of Effort (LOE) Best Practice Tips” discusses common LOE issues and provides suggestions on how to ensure LOE is properly planned and managed.
Interested in Learning More?
The NDIA IPMD Clearinghouse Committee is a useful resource for industry to discuss EVMS related issues and identify options to resolve them. H&A is a direct conduit to the Clearinghouse Committee co-leads that work with the government counterparts to document recommended solutions. If you need help resolving an issue with your EVMS, we can help. Call us today.
A common Earned Value Management System (EVMS) compliance and surveillance review finding are issues with a contractor’s estimate at completion (EAC) process. A credible EAC is essential to successfully manage all contracts and projects.
EACs are important because they provide a projection of the cost at contract or project completion, which is also an estimate of total funds required by the customer. It matters because EACs represent real money. When the most likely EAC exceeds the negotiated contract cost, the contractor’s profit margins may be at risk. It also creates a problem for the customer when the most likely EAC exceeds their funding limits.
We recently updated our blog titled Maintaining a Credible Estimate at Completion (EAC) to highlight why this is a good time to review and potentially update your estimate to complete (ETC) and EAC processes. The updated blog added content specific to:
Incorporating integrated master schedule (IMS) analysis to test the realism of the EAC to identify any disconnects with the cost-based independent EACs (IEACs). It is equally important to determine a realistic forecast completion date (FCD).
Ensuring control account managers (CAMs) are in a position to substantiate their schedule timeline, resource requirements, and cost estimate to complete the remaining work. It is equally important that project managers proactively take the action of “scrubbing” the CAM’s detail ETC/EAC and verifying the data to gain a better understanding of the project’s current state. This improves the quality of the project-level forecast completion date as well as the range of project-level EACs.
Suggested actions to review and enhance current processes from basic steps, such as incorporating an analysis of the IMS Current Execution Index (CEI) to gain an understanding of how well project personnel can forecast into the future, and taking advantage of AI tools to provide additional data analysis insight.
In addition, the publication of the EIA-748-E Standard for EVMS revised 27 guidelines and related updates to government agency guidance such as the DoD EVMS Interpretation Guide (EVMSIG) will require contractors to review and remap EVM System Description content to the revised set of guidelines. The updated blog emphasizes this is a good time to revisit internal ETC/EAC processes and procedures to determine where improvements can be made as well as to ensure project personnel are following the documented processes. The EIA-748-E split the EIA-748-D Guideline 27 into two guidelines. The EIA-748-E Guideline 20 is specific to the control account level EACs and Guideline 23 is specific to the project level EACs. An EVM System Description should have content specific to the process at the control account level as well as the project level that can easily be mapped to the EIA-748-E Guidelines 20 and 23.
Do Your Internal Processes and Procedures Need a Refresh?
H&A earned value consultants routinely assist contractors with updating their internal processes and procedures to reflect the evolving EVMS requirements and guides, regulatory environment, and toolset capabilities. Workflow steps can often be simplified and the quality of performance analysis can be improved with a refreshed approach that reduces the time needed to produce reliable and actionable information. Call us today at (714) 685-1730 to get started.
“Data! Data! Data!” he cried impatiently. “I can’t make bricks without clay.”
-Sherlock Holmes, The Adventure of the Copper Beeches
There are many discussions about EACs and evaluating EACs including using Independent EAC (IEAC) formulae to compare with the contractor EACs. With good reason, we should wonder how accurate are those IEACs that we use so often and sometimes make decisions based on them. Are we misjudging contractor’s EACs based on formulae that are weak or inappropriate?
Humphreys & Associates has initiated a study to determine how accurate IEACs are, and we would like your help. The study will compare different IEAC formulae against the Program Manager (PM) most likely EAC at the 25, 50, and 75 percent complete point for completed projects. The objective is to assess how closely the IEACs and PM most likely EAC were able to predict the final cost outcome for the project.
How Accurate are IEAC Formulae?
Many formulae exist for using recorded data from an earned value management system (EVMS) to make independent estimates of the final cost at completion (EAC) for the element in question. The element might be a control account, a Work Breakdown Structure (WBS) element, or even an entire project.
What is not known is how accurate these methods are at forecasting the final actual cost for the project. This study hopes to determine that answer.
Real World IEAC Data
This study was initiated by collecting earned value data from 12 completed projects. We need projects that are completed because, on a completed project, the final actual outcome is known. We collected project data at the 25, 50, and 75 percent complete points. At each of these points, the IEAC formulae were applied to determine how closely they were able to predict the final actual cost outcome for the project. The quest is to learn how the various IEACs performed. Is any one of them more accurate than the others?
From this investigation, any indication of the relative efficacy of the formulae would be used to inform future use of the IEAC methods.
Our Method for Testing IEACs
In general, the IEAC approach is to use existing recognized formulae. We have chosen these IEACs as a starting point:
IEAC 1 = BAC/CPIe at the percent point reported. This formula can be stated in words as “the entire project is performed at the same efficiency as experience to date.”
IEAC 2 = ACWP + [BCWR/CPI (.5) + SPI (.5)]. This formula uses weighted SPI and CPI which theoretically allows for sensitivity to both cost and schedule historical performance. The weights used in this application are even at .50 and .50.
IEAC 3 = ACWP + [BCWR/CPI x SPI]. This formula uses the SPI and CPI multiplied together which theoretically allows for sensitivity to both cost and schedule performance to date.
IEAC 4 = ACWP + BCWR. This formula assumes the remaining work will be done as budgeted with no factoring.
One additional non-traditional IEAC will be used.
IEAC 5 = Use of IEAC 2 weighted SPI and CPI but decreasing the proportion applied to the SPI as the percent of project completion increases. In other words, the impact of schedule performance diminishes as the project becomes closer to completion.
We will also take the average of all the formulae to see how that works.
Initial Data Set
One aerospace contractor and one US Government agency have provided the required data for 12 completed projects with an interest in the outcome of the study. The source of the data and the specific projects will not be disclosed in the study.
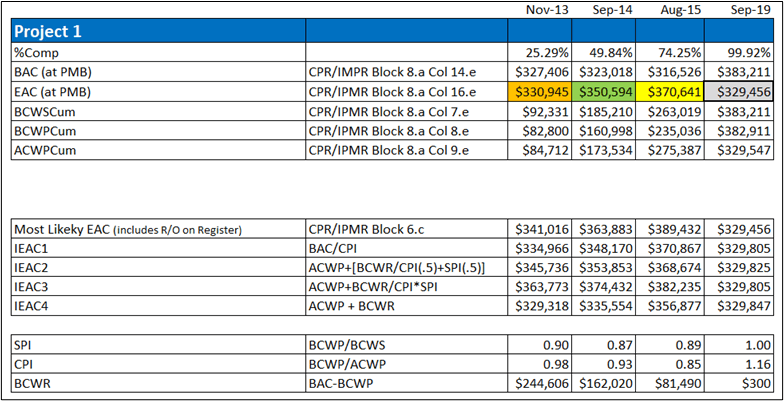
These real-world projects did not have an exact 25%, 50%, or 75% dataset. The closest dataset to each of those completion percentages was used. One example dataset looks like this (color coding should be ignored):
How can you help?
We need more project data to gather enough varying project outcomes to make the test realistic. We do not plan to keep the types of projects or products separate but will take all the data we can get and look at them all.
Please consider providing data for the study. We have created an Excel spreadsheet template to help gather project data in a common format for analysis. You can download this template here. Add as many tabs as needed for each project. Send your completed spreadsheet to humphreys@humphreys-assoc.com.
In a separate blog we will outline other help we need to complete the study and to analyze the results.
A previous blog, Maintaining a Credible Estimate at Completion (EAC), discussed why producing a realistic EAC is essential to managing the remaining work on a contract. Internal management and the customer need visibility into the most likely total cost for the contract at completion to ensure it is within the negotiated contract cost and funding limits.
As noted in the earlier blog, one common technique to test the realism of the EAC is to compare the cumulative to date Cost Performance Index (CPI) to the To Complete Performance Index (TCPI).
Example of Using the Metrics for Evaluating Data
One example of documented guidance to industry for evaluating the realism of the EAC is the DOE Office of Project Management (PM) Compliance Assessment Governance (CAG) 2.0, and the related DOE EVMS Metric Specifications they use to assess the quality of schedule and cost data. This blog highlights the use of this guidance and how any contractor can incorporate similar best practices to verify EACs at a given WBS element, control account, or project level are realistic.
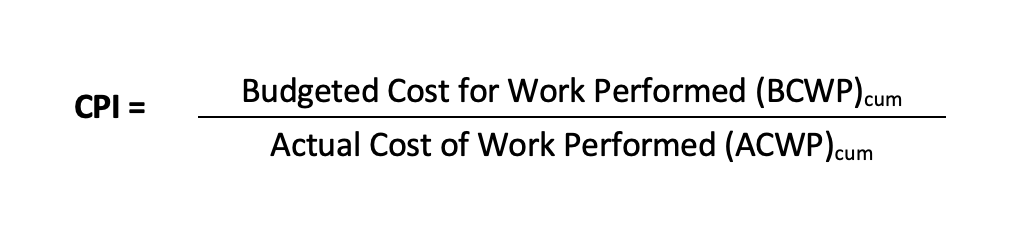
To refresh, the CPI is the efficiency at which work has been performed so far for a WBS element, control account, or at the total project level. The formula for the cumulative to date CPI is as follows.
Best practice tip: To ensure a valid CPI calculation, verify the BCWP and ACWP are recorded in the same month for the same work performed.
The TCPI provides the same information, however, it is forward looking. While the CPI is the work efficiency so far, the TCPI is the efficiency required to complete the remaining work to achieve the EAC. The formula for the TCPI is as follows.
Best practice tip: To ensure a valid TCPI, verify the BCWP and ACWP are recorded in the same month for the same work performed, and the BAC and EAC are for the same work scope. In other words, the scope of work assumptions are the same for the budget and remaining cost. This is why anticipated changes should not be included in the EAC.
The DOE uses the CPI in two of their assessment metrics and the TCPI in one, however, these are critical metrics partly because they are the only ones used to assess two different data evaluations: 1) commingling level of effort (LOE) and discrete work, and 2) EAC realism.
Commingling LOE and Discrete Work
The first use of CPI (no TCPI in this metric) falls under the Budgeting and Work Authorization subprocess. The primary purpose is to evaluate the effect of commingling LOE and discrete work scope has on control account metrics. The basic premise for this metric is that if the CPI for the LOE scope is significantly different than that for the discrete, the mixture of LOE in that control account is likely skewing overall performance reporting.
Here is the formulation DOE uses.
C.09.01: Control Account CPI delta between Discrete and LOE >= ±0.1
X = Number of incomplete control accounts (WBS elements) in the EVMS cost tool, where
The LOE portion of the budget is between 15% and 80% of the total budget, and
The difference between the CPI for the discrete work and the LOE work is >= ±0.1.
Y = Number of incomplete control accounts (WBS elements) in the EVMS cost tool.
Threshold = 0%
Best practice tip: Run this metric quarterly on your control accounts that commingle LOE and discrete work packages. When there is a significant discrepancy between the performance of the LOE versus discrete work effort, consider isolating the LOE effort from the discrete effort at the earliest opportunity. An example could be the next rolling wave planning window or as part of an internal replanning action. Alternatively, it may be necessary to perform the calculations at the work package level to assess the performance of just the discrete effort when it is impractical to isolate by other means.
Process and procedure tip: Ensure the LOE work packages within a control account are kept to minimum (typically less than 15%), during the baseline development phase. This helps to prevent discrete work effort performance measurement distortion during the execution phase. A useful best practice H&A earned value consultants have helped contractors to implement during the budget baseline development process is to perform an analysis of the earned value methods used within a control account and the associated work package budgets. This helps to verify any LOE work packages are less than the 15% threshold for the control account. In some instances, it may be logical to segregate the LOE work effort into a separate control account. The objective is to identify and resolve the issue before the performance measurement baseline (PMB) is set.
EAC Realism
One DOE metric uses the TCPI and this involves a comparison to the CPI. This falls in the Analysis and Management Reporting subprocess. This DOE EVMS Metric Specification states: “This metric confirms that estimates of costs at completion are accurate and detailed.” As noted above, the metric compares the cost performance efficiency so far to the cost efficiency needed to achieve the EAC and is specific to the EAC a control account manager (CAM) would review for their scope of work. Depending on the level actual costs are collected, this analysis may need to be performed at the work package level instead of the control account level.
Here is the formulation DOE uses assuming actual costs are collected at the work package level.
F.05.06: Work Package CPI – EAC TCPI > ±0.1 X = Number of incomplete (>10% complete) work packages where CPI –TCPI > ±0.1. Y = Number of incomplete (>10% complete) work packages in the EVMS cost tool. Threshold = 5%
There is no requirement that the forecast of future costs has a linear relationship with past performance. While there may be legitimate reasons why future cost performance will fluctuate from the past, outside reviewers who receive EVM data will look for a trend or preponderance of data that would indicate the EACs are not realistic. When a significant number of active work packages are outside the ±0.1 CPI-TCPI threshold, it is an indication that the EACs are not being maintained or are driven by factors other than project performance.
Best practice tip: Run this metric every month for each active work package prior to month-end close. For those work packages outside the ±0.1 threshold, review the EAC to ensure it is an intentional forecast of costs given the current conditions.
Process and procedure tip: One of the training courses H&A earned value consultants often conduct is a Variance Analysis Reporting (VAR) workshop. This workshop is designed to help CAMs become more proficient with using the EVM metrics to assess the performance to date for their work effort, identify the root cause of significant variances, and document their findings as well as recommended corrective actions. This analysis includes verifying their estimate to complete (ETC) is a reasonable assessment of what is required to complete the remaining authorized work and their EACs are credible.
Additional References
Further discussion on using the CPI and TCPI to assess the EAC realism at the project level can be found in the DOE CAG, Analysis and Management reporting subprocess, Estimates at Completion. This section provides a good overview of comparing the cumulative to date CPI to the TCPI as well as comparing an EAC to calculated independent EACs (IEACs) for further analysis to assess the EAC credibility.
Interested in learning more about using EVM metrics as a means to verify EACs at the detail or project level are realistic? H&A earned value consultants can help you incorporate best practices into your processes and procedures as well as conduct targeted training to improve your ETC and EAC process. Call us today at (714) 685-1730.
Originally published March 2023 | Revised May 13, 2026
Quick Summary
EVMS compliance and surveillance reviews continue to identify issues related to poor-quality estimates at completion (EAC), underscoring the need for credible EACs to support effective project management, financial integrity, customer confidence, and funding decisions.
Credible EACs require actively maintained, data-driven estimates to complete (ETCs) that integrate schedule, resource, cost, and risk information along with regular management realism assessments and open communications with all stakeholders.
Organizations can improve EAC credibility by avoiding management imposed targets, keeping schedule and cost systems aligned, routinely reviewing the quality of the ETC data, leveraging evolving tools and analytics, and updating processes to align with the revised EIA-748-E guidelines.
The Defense Contract Management Agency (DCMA) as well as other government entities responsible for Earned Value Management System (EVMS) compliance and surveillance continue to identify issues with the quality of contractor estimates at completion (EAC). Using DCMA statistics, EIA-748-D Guideline 27, Maintain Estimates at Completion, is one of three guidelines1 that represent a third of all EVMS Corrective Action Requests (CARs).
Why Credible EACs Matter
A credible EAC is essential to all stakeholders and a foundation for managing projects successfully. Executive management and project managers must have a complete and accurate understanding of the projected contract or project EAC to ensure financial data is not misrepresented (Sarbanes-Oxley). The customer must have confidence in a contractor’s forecast completion date (FCD) and EAC data to understand whether the remaining work can be completed within the contractual period of performance and target cost, or, if not, how long it will take and how much it will cost.
When the most likely EAC exceeds the negotiated contract cost, the contractor’s profit margins may be at risk. Should the most likely EAC exceed the customer’s funding limit, they will need to secure additional funding, modify the work scope, or slow the pace of the project. No one likes schedule or cost surprises.
What determines whether an EAC is credible?
A credible EAC reflects the cumulative to date actual costs of work performed (ACWP) (costs the contractor has already incurred) plus the current ETC. The ETC must provide a realistic estimate of the time and resources required to complete the remaining authorized work using projected rates. It represents the time phased estimate of spending which translates to the future funds required.
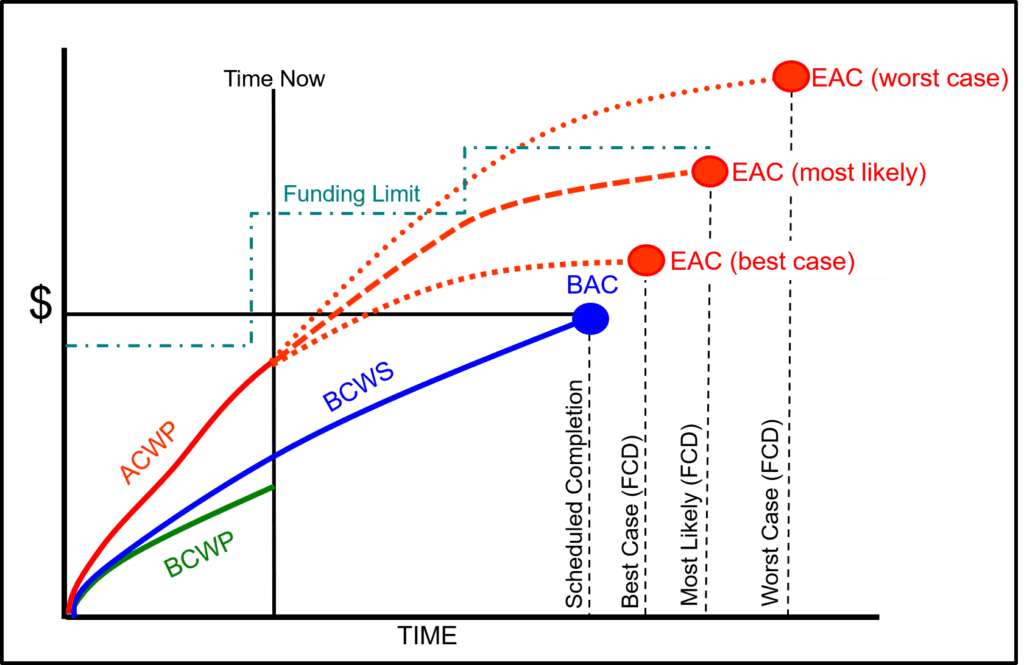
EACs should be based on actual costs and performance to date, the nature and amount of remaining scope, assumptions about and projections of future performance for that scope, risks and opportunities, economic escalation, expected direct and indirect rates, subcontract, and material commitments. As illustrated in Figure 1, project managers should routinely evaluate their project’s ACWP, ETC, and range of EACs along with the funding profile to verify amounts expended and forecasted are within the parameters of available contract funds.
Figure 1: Range of Project EACs with Funding Profile
What project control practices help to ensure EACs are realistic?
Three recommended best practices include:
Actively maintaining the detail ETC data every reporting cycle. This starts with updating the current schedule to include all authorized remaining scope along with the resource loaded activities to reflect performance to date and the latest planning (timing and resource requirements) for work in progress and future work effort. This is the basis for updating the time phased cost estimate for in progress work packages that is added to the cumulative to date actual costs as well as the cost estimate for future work/planning packages. Subcontract forecasted schedules and cost must be included. The current schedule forecast dates and time phased cost estimate must be aligned. Actively maintaining the detail data ensures the current schedule and ETC data reflect the project’s current state. The control account managers (CAMs) can substantiate their ETC with relevant data for analysis and take action to address a significant variance at completion (VAC).
Actively monitoring project FCDs and EACs. Project managers that routinely maintain a range of data driven FCDs and EACs (best case, most likely, and worst case) are better prepared to verify the control account FCDs and EACs are realistic, realized risks have been handled, and emerging risks have been identified, assessed, and addressed. Experienced practitioners use various metrics such as comparing the Cost Performance Index (CPI) to the To Complete Performance Index (TCPI) to test the realism of the EAC. They also include a realism check of the baseline and current integrated master schedule (IMS) to identify any potential disconnects with the cost-based indices discussed in a previous blog, Incorporating IMS Information Directly into IEAC Formulas. Managers should scrub the detail ETCs to assess the quality of the estimates and verify the content of the backup data. A good understanding of the detail ETCs is necessary to produce credible project level EACs with crisp rationale and narratives provided to executive management and the customer.
Maintaining open communications with all levels of management, subcontractors, and the customer. The project manager is the main conduit to manage impacts to their project’s FCD and EAC such as when finance changes direct or indirect rates, there are changes in resource availability or a spike in material prices, or the customer modifies the work scope or funding. As a result, project personnel can quickly handle issues or project changes. Direct and open communications with executive management ensures there is a clear understanding of their project’s FCD and EAC.
What are some things to avoid?
H&A consultants often observe practices that negate the value of maintaining the ETC/EAC and can result in an EVMS corrective action request (CAR). The root cause often points to ad-hoc processes or corporate culture. Examples:
Management provides a target FCD and EAC number the CAMs must match. The ETC/EAC should be “the voice of the CAM”. The CAM is saying “if you give me these resources as scheduled, I can finish the job this way.” Any approach that does not respect the voice of the CAM can cause the ETC/EAC to be unrealistic or at least unsubstantiated. Giving the CAM “the date and number” increases the likelihood the FCD and ETC are unrealistic. There may be a valid reason for this directive as a management what-if exercise or to gain a deeper understanding of the situation. When done as a routine management strategy, it diminishes the value of the ETC data to manage the project’s remaining work and prevent cost overruns. The CAMs should be in a position where they can substantiate their schedule timeline, resource requirements, and cost estimate to complete the remaining work. Project managers should be in a position where they can verify the detail ETC/EAC data to establish a level of confidence in their project level EACs they provide to executive management and the customer.
Project personnel take the path of least resistance. This is often an indication of a lack of direction or an established process. They either do not create the ETC data or maintain it on a routine basis. In some instances, the CAMs manage their ETC data to avoid oversight. An old but valid saying is “the tall grass gets mowed” – the CAM purposely doesn’t raise their ETC to a value that would attract attention. Another troublesome approach is to set a cost management tool option to a static EAC; the CAM may manually update the EAC number quarterly at best. The result? The FCD and ETC data isn’t current; there is zero insight into potential emerging issues. DCMA or the customer can easily identify this when they analyze the time-phased ETC data in the Integrated Program Management Data and Analysis Report (IPMDAR) Contract Performance Dataset (CPD) submittal.
Schedule and cost are created/maintained separately. This often occurs when the schedule and cost tools are not kept in sync for the project’s duration. Significant effort may go into ensuring the data are in alignment to establish the performance measurement baseline (PMB). The IMS resource loaded activities are used as the basis for the time phased budget baseline in the cost tool. However, the ETC data in the current schedule may not exist or be actively maintained. Project personnel only maintain the ETC data in the cost tool and fail to verify it aligns with the current schedule activity forecast dates and resource requirements. It is not part of their routine status and analysis process every month.
Taking Action to Review and Enhance Current Processes
A simple step to start with is to use the IMS Current Execution Index (CEI). This is a useful measure of how well a team can forecast just a single month into the future. If a team cannot achieve a high accomplishment rate against just a one-month forecast, any longer-term ETC is questionable. Start simple and focus on improving the one-month accuracy then move on to longer periods. Build confidence in the team’s ability to see and manage the future.
Another basic step. Build time into the process for managers to scrub ETCs. Maybe it is not possible to scrub every control account ETC every reporting period, but a rotational approach where ETCs are scrubbed as often as possible will improve the ETC and improve the understanding of the ETCs.
Innovate. AI tools are rapidly becoming capable of assuming skilled roles such as project analysts and can yield valuable insight. Tools are already available that can evaluate variances and variance analysis reports (VARs). Poor quality analysis translates to poor quality ETCs. Take action that supports improved analysis.
At a higher level, with the publication of the EIA-748-E Standard for EVMS revised 27 guidelines along with the evolving regulatory environment discussed in a previous blog, Revitalizing Earned Value Management Systems, this is a perfect time to review current EVMS ETC/EAC processes. The EIA-748-E split the EIA-748-D Guideline 27 into two parts: EIA -748-E Guideline 20 focuses on the control account level EACs and Guideline 23 focuses on the project level EACs. The DoD EVMS Interpretation Guide (EVMSIG) for Revision E has been updated accordingly.
We recommend reviewing approved EVM System Descriptions to ensure existing content supports the EIA-748-E Guideline revised text as well as remapping content to the EIA-748-E Guidelines and applicable government guides such as the DoD’s updated EVMSIG. Take the time to determine whether the documented processes make sense. If project personnel are ignoring the current process, it may be an indication it needs a revisit; it may need to be simplified or redone.
Consider reviewing the schedule data quality assessment process. Are project schedules providing an accurate forecast of the time required to complete the remaining work effort? This includes assessing whether task duration estimates are realistic as discussed in another blog, Improving IMS Task Duration Estimates. The IMS is the first line of defense to identify the potential that a cost overrun issue is likely to occur.
Lastly, open communication is essential to ensure technical, schedule, or cost realized risks are visible to all stakeholders. What is certain in any project plan is that things will not go as planned. Success depends upon quickly identifying the root cause of an issue and correcting course to reduce or eliminate the impact.
Reminder of the Objective of the ETC/EAC
The ETC is the detailed step-by-step plan the CAM provides to show how the remaining work will be accomplished. The goal of maintaining a credible ETC and EAC is to verify an executable plan is being regularly updated to accomplish the remaining scope of work within the contract’s schedule, cost, and funding targets for internal management visibility and control. The customer must also have confidence in the contractor’s ability to deliver and meet the remaining contract objectives.
The best way to prevent an ETC/EAC process CAR is to ensure you have a useful established process personnel follow, and they know how to use the schedule and cost tools to consistently maintain quality schedule as well ETC and EAC data. H&A scheduling and earned value consultants have worked with numerous clients to design or enhance their ETC/EAC process. H&A also offers EVMS training workshops that include content on how to develop a realistic EAC. Regular EVMS training always helps to reinforce best practices. Call us today at (714) 685-1730 to get started.
I’ll answer this provocative question now. DCMA, local and headquarters, are an EVM contractor’s “friend” with remarkable, but not unlimited, patience. When required, DCMA can become the contractor’s “tough love” friend.
DCMA and the contractor share the same interests – successful contract performance. DCMA is part of a triad that includes the Government’s program team, the contractor’s program team and their DCMA counterparts.
The title “Defense Contract Management Agency” reminds me of “grilled cheese sandwich” – the recipe and the product are in the name – “contract management” leads to well managed contracts.
EAC Vignette – Part One:
Contractor A has learned that their collocated DCMA has concerns about the company’s EAC process and resulting declared EACs. The company has learned that a Level III CAR on GL # 27 is being considered. Contractor A’s senior management decides to replace their EVM Core Leader with “new blood” to improve the company’s “relationship” with DCMA and avoid a Level III CAR.
Contractor A’s new EVM leader meets with her team and with the program managers that have an EVM contractual requirement. Company A’s new EVM leader is told that DCMA’s EAC concerns are a new issue. The company’s new EVM leader asks to meet with her DCMA counterpart to discuss their GL # 27 concerns, and to present a draft of a Corrective Action Plan (CAP).
During the meeting with DCMA’s EVM leader she mentions that the EAC concerns were a surprise to the company. The company’s new EVM leader briefs her draft CAP to her DCMA counterpart.
After the draft CAP has been briefed, the DCMA EVM leader comments, “your draft CAP is a good start. After I have time to fully digest your draft CAP I will send my comments and suggestions. As for being surprised by our EAC concerns, here is a file with 3+ years of letters, emails, meeting minutes from DCMA to your company outlining our continuing and growing concerns with your company’s EAC process.”
EAC Vignette – Part Two:
DCMA issued a Level III Corrective Action Request (CAR) to the contractor and is considering withholdings as an incentive for the company to quickly improve their EAC processes.
As promised, the DCMA EVM leader sent the following note to the company’s new EVM leader:
“I sent your draft GL # 27 CAP to my team for their comments and recommendations. My team’s key recommendations are:
1). Identify the weaknesses in your existing EAC processes. For each weakness, identify a corrective action. As much as possible, “mistake proof” your new processes. You should consider a review of several 100% complete contracts, and “replay” those contracts month-by-month using your new EAC processes to test their effectiveness.
2). As noted in our CAR, the company is required to report progress on the Corrective Action Plan (CAP). You should treat your CAP as a program. At a minimum, you should have an IMS and use appropriate earned value techniques to measure progress.
3). A sister division in your parent corporation, has a very mature and effective EAC process. You should considering asking for their assistance as you develop your CAP and begin its execution.
4). If you have questions as you execute your CAP, please don’t hesitate to contact me. If I don’t know the answer to your question, I’ll find someone that does know the answer and will share it with you.”
Personal Observations:
Based on my 32 years as an employee of defense contractors, and 7 years in earned value consulting, I offer the following:
1). DCMA “local” knows your company much better than you might think.
2). DCMA “headquarters” has knowledge and insight into many companies. From DCMA’s website: “We are the independent eyes and ears of DoD and its partners, delivering actionable acquisition insight from the factory floor to the front line …. around the world.”
3). A CAR from DCMA informs the company of “what” needs corrected but not “how” to correct the issue. That said, DCMA knows what will or will not work. Maintain a dialogue with DCMA.
4). “Compliance” is a lower bound for performance. DCMA will not object if a company decides to improve well beyond mere compliance.
5). Please consider the possibility that what may appear to be a “new” problem for your company, may have already been solved by another company. Find who has already solved your “new” problem. Ask for help.