EVMS compliance: Material Transfers and Loan/Paybacks
Earned Value Management System (EVMS) Compliance | Material Transfers and Loans/Paybacks
Last Updated May 22, 2025
In a high rate production environment, it is not unusual for different Contract Lot Buys to have demands for the same required parts. Circumstances driven by delivery schedules, fee incentives, national priorities, or quality issues will prioritize the demand for these common parts. Companies must ensure they are able to respond to these dynamics while satisfying contractual requirements and continuing to remain compliant with the EIA-748 Standard for Earned Value Management System (EVMS) guidelines. A documented Material Transfer and Borrow and Payback (e.g., TBLP) policy/procedure describing a disciplined, auditable approach is a mandatory prerequisite for project managers in an EVMS contract environment.
Material Management and Accounting System (MMAS)
There are a number of applicable Government documents that come into play but none more important than the Material Management and Accounting System (MMAS). It is a DoD Policy (DFARS 242.7202) that contractors have a MMAS that:
(1) Reasonably forecasts material requirements.
(2) Ensures the cost of purchased and fabricated material charged or allocated to a contract are based on valid time-phased requirements.
(3) Maintains a consistent, equitable, and unbiased logic for costing of material transactions.
DFARS.242-7004 Material Management and Accounting System Subpart, paragraph (d) System criteria includes a list of requirements. Selected subparagraphs discuss material transfers and loan/paybacks as follows:
- Subparagraph 6 (Material Transfers) requires the contractor’s policies and procedures provide detailed descriptions of circumstances that will result in manual or system generated transfers of parts.
- Subparagraph 7 (Material Costing) requires that the contractor’s system transfer parts and associated costs within the same billing period or use an Administrative Contracting Officer (ACO) approved “Loan/Payback” technique.
- Subparagraph 8 (Inventory Allocations) requires that the contractor’s system handle allocations of common inventory in such a manner as to preclude improper allocation and costing of allocations.
Material Transfer versus Loan/Payback
For a number of reasons, a material transfer involves the most problematic issues for accommodating changing demands and priorities for common parts:
- Transfer costs are based on labor, material and applicable burdens when originally incurred and not based on the year when they are physically transferred (i.e. 2024 costs vs. 2025 costs). Related funding issues may also surface (requesting 2014 funding to ‘build’ a 2024 requirement in 2025).
- Replacement costs will, in most cases, be at a higher value and there may be a potential schedule impact; both represent negative impacts to the customer.
- Previously reported Budgeted Cost for Work Performed (BCWP) and Actual Cost of Work Performed (ACWP) for work already accomplished will be impacted.
- Potential for inadvertently gaining a cost benefit when transfers are made between a Cost Plus and Fixed Price contract.
A transfer approach should only be considered when there is no replenishment currently in the procurement system. If there is a replenishment currently in the ‘pipeline’ then a loan/payback approach should be used as this will result in no cost transfer.
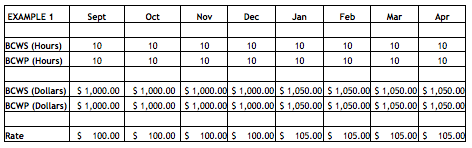
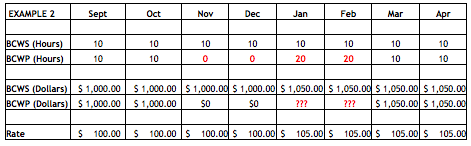
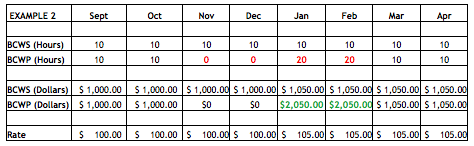
Under a loan/payback scenario, a part is moved temporarily from the contract, but the cost of the part remains on the contract. As noted earlier, contractor procedures for the loan/pay-back technique must be approved by the ACO. When the technique is used, the contractor must have controls to ensure that:
- Parts are paid back expeditiously.
- Procedures and controls are in place to correct any over-billing that might occur.
- Monthly, at a minimum, identify the borrowing contract and the date the part was borrowed.
- The cost of the replacement part is charged to the borrowing contract.
Material management and planning within an EVMS environment is quite challenging. Thankfully, there are a number of Earned Value Management Systems software programs available to assist contractors in meeting and managing this challenge.
A number of Humphreys & Associates earned value consultants have extensive experience in production environments that can assist in guiding your efforts in this complex endeavor to ensure a firm foundation is established that meets or exceeds your material management and EVMS needs. Call us today at (714) 685-1730.
EVMS compliance: Material Transfers and Loan/Paybacks Read Post »