Determining Responsibility for Indirect Cost Variance Analysis – Part 2

How are the Indirect Cost Rates Used on Projects?
The debate that has continued since the inception of the earned value concepts in the 1960s has been: “Who should report on and analyze the cost variances attributable to indirect costs?”
This blog is the second in the series of blogs to help answer this question. The first blog covered a few fundamentals about how indirect cost rates are established to set the stage. This blog discusses how indirect rates are applied and how project personnel display indirect costs for internal or performance reporting. Part 3 concludes the discussion on the indirect cost variance analysis process. It covers what the EIA-748 Standard for Earned Value Management Systems (EVMS) and related government agency guides have to say on the subject as well as discussing the best option for determining who is responsible for indirect cost variance analysis.
There are a number of variables at the project or detail work element level related to indirect costs we often encounter when working with our clients. These variables can influence the level of visibility into how the indirect costs are impacting the project’s total cost. For example:
- Accounting may only provide a summary or “wrap” set of direct or indirect rates to the project offices to apply to the project’s base budget or estimate to complete (ETC) values. The rate details may be unknown to project personnel since they are provided a “composite” rate for planning a performance measurement baseline (PMB), actual cost accumulation, and later for estimating ETCs.
- The control account level work authorizations may or may not include indirect costs. The control account managers (CAMs) may or may not have visibility into the total cost for the work effort they are responsible for.
- The level of detail the customer is requesting the contractor to display the indirect costs for performance reporting.
Applying the Indirect Rates at the Detail Level
The current approved direct and indirect rates are applied at the lowest level where the CAMs are planning their work resource requirements. This is usually at the work package level where the CAMs plan their time phased budget labor hours, material quantities or direct cost, subcontract, or other direct costs (ODCs) that match when the work package activity is scheduled to occur. This helps the CAMs to determine what direct and indirect cost factors make up their total cost for their control account.
Example Control Account Analysis of Time Phased Direct and Indirect Costs
An example output a CAM could use to analyze their budget time phased element of cost details is illustrated in Figure 1 (produced from ProjStream MaxTeam ). Assuming the CAM has indirect costs in their control accounts, a similar approach is used for their time phased ETC.
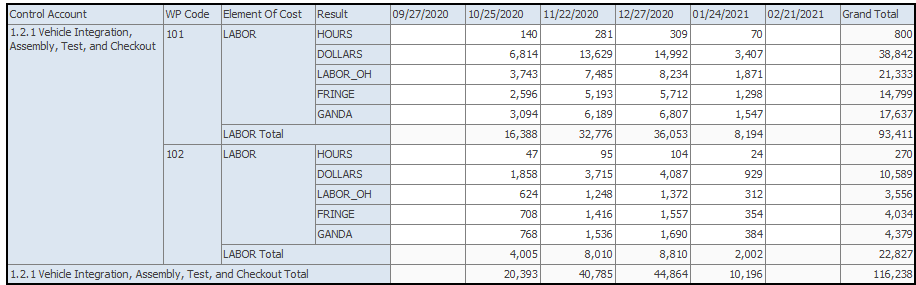
Why is this level of detail useful to the CAMs and project managers? When they are planning to process a baseline change request (BCR) for future work budget, or if they modify their ETC, they can quickly see the impact of changing an element of cost. Examples include switching from make to buy or buy to make, increasing or decreasing hours, changing the duration of an activity, or swapping out labor resources (a different skill mix) on the associated indirect costs.
How Direct and Indirect Costs are Displayed for Use on a Project
While it may seem obvious, it is worthwhile to point out that project personnel:
- Do not control how indirect costs are applied. The corporate Cost Accounting Standards Board (CASB) Disclosure Statement or similar accounting procedure controls this. Finance or accounting provides the current set of approved direct and indirect rates the project offices are directed to use.
- Do control their base direct costs (labor hours, material quantities or direct cost, subcontract, or ODCs). The approved direct labor rates and indirect rates are applied to these base direct cost values.
- Do control how the indirect costs are displayed for internal use or performance reports.
Project direct and indirect cost information can be summarized and displayed at various levels of detail that project personnel can use as needed. The purpose of the following simplified “dollarized” responsibility assignment matrices (RAMs) is to illustrate different ways internal budget data could be displayed to provide some level of visibility into the project’s indirect costs.
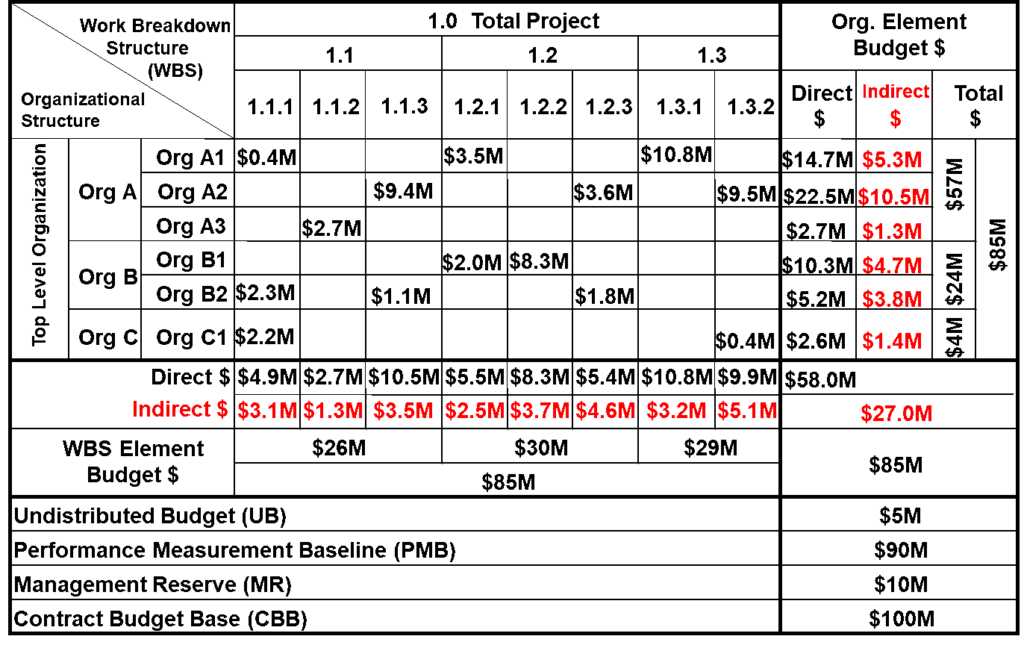
Indirect Costs Displayed at WBS and Organizational Structure Elements
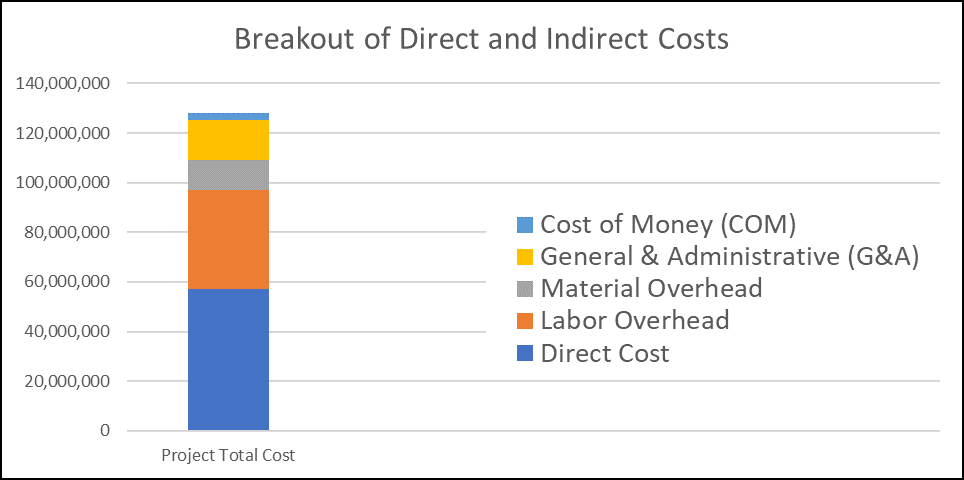
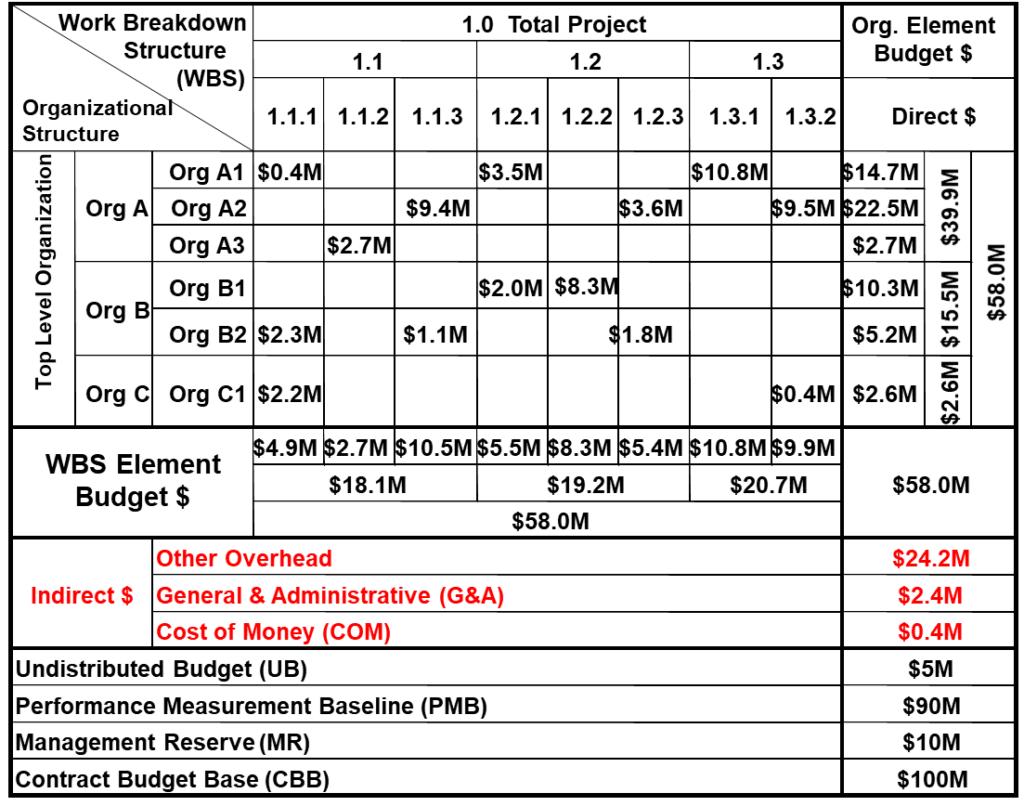
In Figure 2, the total indirect cost amounts are shown at the WBS reporting elements (1.1.1, 1.1.2, etc.), and also by the organizational elements (Org A1, Org A2, etc.). This provides a project manager visibility into the indirect budgets at these levels. What this RAM does not provide visibility into is the different types of indirect costs that make up the total amounts planned. This could include the various categories of the indirect costs so a project manager could compare the amount of labor indirect, material indirect, general and administrative (G&A) indirect, and cost of money (COM) that are contributing to the total amounts planned. When that level of visibility is desired, Figure 3 illustrates an alternate approach.
Indirect Costs Displayed at the Total Project Level
Figure 3 does not separate out the indirect costs by WBS elements or organizational elements. Instead, it displays the total amounts for each indirect cost pool (summary lines for other overheads, G&A, and COM). The amounts shown at the control account level are only the direct cost budgets assigned to the CAMs in their work authorization documents, which total $58.0M (shown in the lower right corner). Based on how this data is displayed, the expectation would be the CAMs are managing just their direct cost budgets. This approach (total project level) does not provide visibility into the indirect costs at the various WBS or organizational structure element levels.
Fully Burdened RAM
In Figure 4, the entire $85M budget assigned to the CAMs is fully burdened (includes direct and indirect costs). This would be reflected in their work authorization documents. Based on how the data are displayed, the expectation would be the CAMs are managing, analyzing, and reporting on not only the direct costs, but also on the indirect costs for their scope of work. This method, however, gives no visibility into how much of each control account is direct cost versus indirect cost in the RAM. It would be necessary to drill down into the detail work package and resource assignment source data to determine the breakout of direct and indirect costs (see Figure 1).

Fully Burdened RAM with Indirect Cost Summaries for WBS and Organizational Elements
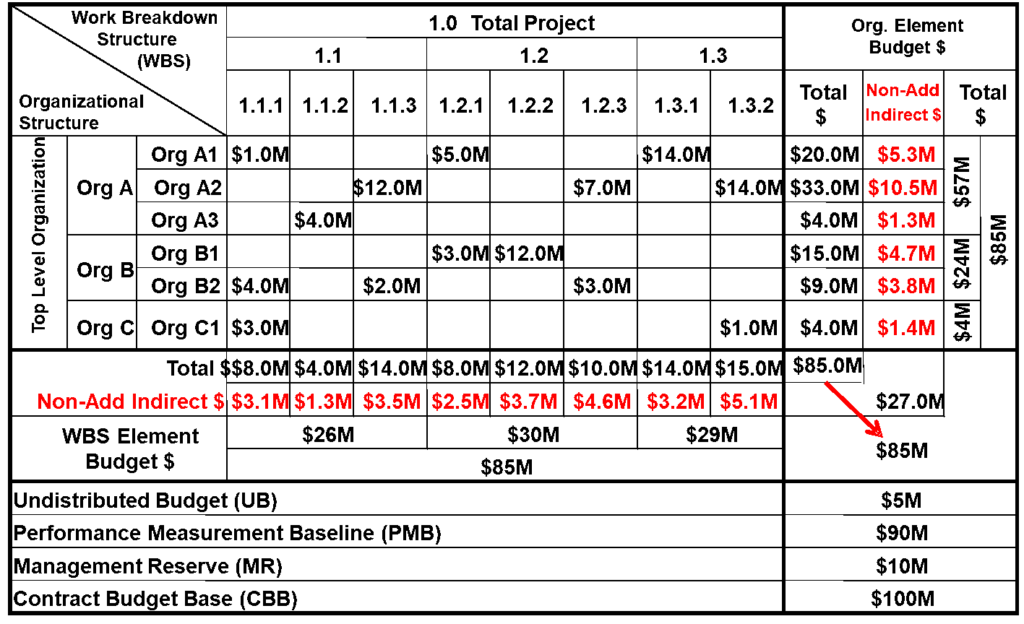
What if the project manager takes a different approach to provide some visibility into the indirect costs? In Figure 5, the body of the RAM reflects the fully burdened (direct and indirect budgets) similar to Figure 4. Additionally, it also provides the total indirect cost summary for each major WBS element and organizational element, in what are called “Non-Add” entries.
Indirect Cost Details in Project Performance Reports
How the project indirect cost information is summarized and displayed also applies to the formal contract performance reports. Customers often tailor the reporting requirements by specifying how they expect indirect costs to be separated out on the Integrated Program Management Report (IPMR) Formats 1, 2, and 7 or provided in the Integrated Program Management Data and Analysis Report (IPMDAR) Contract Performance Dataset (CPD) for visibility into the project’s direct and indirect costs.
Example Partial IPMR Format 1
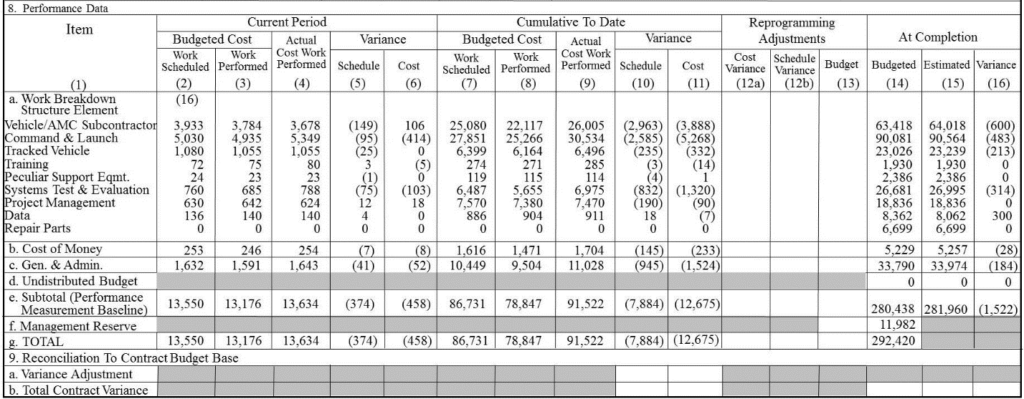
For illustration purposes, a partial example IPMR Format 1 is shown in Figure 6. This example illustrates the typical “default” detail in the body of the report (Block 8. Performance Data, a. Work Breakdown Structure Element). The columns include the direct costs plus other overheads (anything other than COM or G&A) for the WBS element rows. Rows 8. b. and 8. c. separate out the COM and G&A indirect costs at the project level.
This default layout provides limited visibility into the indirect costs of the project. Should the customer want more visibility into the contribution of the indirect costs on the project, tailoring options we often see specified in a contract include:
- The body of the report displays the direct costs for the WBS elements and a summary line is added to provide visibility into indirect costs other than the COM and G&A, which are displayed at the total project level.
- Similar to option 1, the body of the report displays the direct costs for the WBS elements. Instead of one summary line for the other indirect costs, there is a summary line for each indirect pool, as defined in the contractor’s CASB Disclosure Statement. For example, an Engineering indirect cost row, Manufacturing indirect cost row, Material indirect cost row, and Service indirect cost row.
- For each WBS element in the body of report, there are additional rows that break out the direct cost and the indirect cost categories. Sometimes the direct costs are also broken down into the major element of cost categories such as labor, material, subcontract, and ODC.
When the customer requires additional indirect cost detail in the formal performance reports, note that the applicable narrative report (IPMR Format 5 or the IPMDAR Performance Narrative Report) will need to include a discussion on significant cost variances for those indirect cost categories when applicable. This is discussed further in the next blog.
Part 3 of this series of blogs will discuss the cost and schedule variance analysis process and how to determine who should be responsible for indirect cost variance analysis.
Other Posts from this Series
Determining Responsibility for Indirect Cost Variance Analysis – Part 2 Read Post »