Survey of Schedule Acceleration Techniques

The NDIA Integrated Program Management Division (IPMD) Planning and Scheduling Excellence Guide (PASEG) includes a list of the acceleration techniques that can be applied to reduce project schedule duration. That section of the guide provides the background for project team discussions on accelerating complex integrated master schedules (IMS) in government contracting environments. This blog is intended to increase awareness of the techniques in the guide and provide some additional insight into their application. It relies heavily on the guide’s content.
An additional purpose of this blog is to promote the use of the NDIA IPMD nomenclature across the defense industry spectrum. In much the same way as the earned value management (EVM) acronyms of BCWS, BCWP, ACWP and others have become standard terminology, it would be beneficial to have a more standard way of discussing schedule acceleration techniques. As the PASEG is an industry guide developed and maintained in collaboration with U.S Government agencies, the PASEG promotes a common understanding of these techniques.
One caution. Modifications like the ones discussed here can introduce additional risk into the schedule and reduces flexibility. Be careful when modifying the schedule. A good practice is to first create a copy of the schedule and assess the effects of your changes before you adopt them. The trade-offs may or may not be acceptable depending upon the objective you want to achieve. If the schedule is the priority, there is likely to be an impact on the work scope or cost. There can also be unintended consequences when potential impacts are overlooked.
Let’s review the techniques from the PASEG.
- Crashing.
The guide says “This technique allows for the acceleration of schedule by applying additional resources or more experienced resources to do the work in a shorter period of time. This method assumes that the task can be completed in a shorter amount of time with the increase in resources.”
We probably have all used this method when we are shopping on the internet and we are faced with the choice between receiving the item in 5 days or accelerating that to 3 days or even the next day. We are paying more to get it faster. But what is really happening behind the scenes? Do they pick your order first? Do they pack it first? Do they ship it on faster carrier? Those are the actions you would be considering on your project when you want to accelerate something by crashing the schedule.
Using outside or contract labor is a form of this where we boost our workforce for a period when we need extra effort. A form of this is offloading some work to a subcontractor.
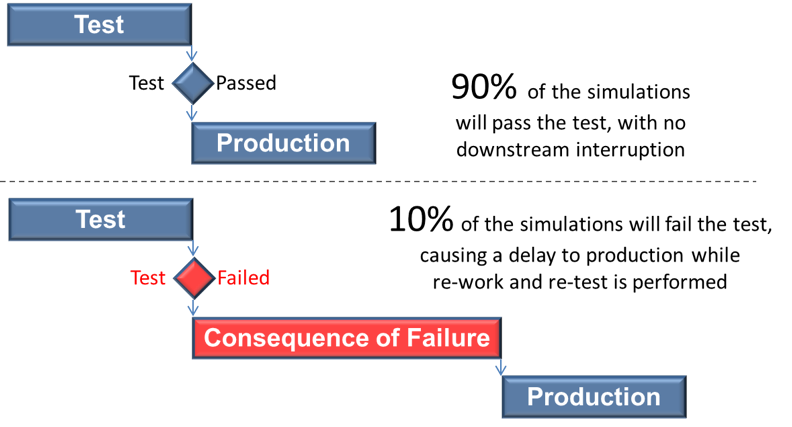
A more detailed example comes from the factory setting where certain orders are “expedited”. What that might mean is that the normal movement process is subverted. The normal process might be as shown in Figure 1 with a queue time while your order waits for the machine. The machine will be torn down and set up for your work when it is most efficient to do so.

When you crash this process, you might simply remove the queue time so that as soon as your order arrives the machine is torn down and set up for your job to eliminate the wait time as shown in Figure 2.

However, using this approach is likely to increase cost and has the potential to introduce other risks to the project. A real-world example comes from the semiconductor industry where the factory was running both standard products and custom products. A normal custom order time of 8 weeks was cut to 2 weeks by using this approach. The cost that was charged to the customer for the rushed custom order was about 10 times the normal cost of an order to repay the factory for lost efficiency.
- Fast-tracking.
The guide tells us “This technique accelerates the plan by performing work in parallel. With this method, extra attention needs to be put on resource de-confliction to ensure resources are not over allocated.”
We have all used this technique and probably had mixed outcomes. It seems simple and attractive. It embodies a “just get it done” mentality. If there are sufficient trained and capable resources then this can work. The resources can be used on both efforts at the same time. If that is not the case, then basically we would have to revert to pushing effort out of the way for another effort. This type of modification can introduce additional risk that may need to be mitigated.
- Streamlining.
The guide defines this technique in this way: “This technique depends on the team’s ability to find an alternate and more efficient completion methodology for the task/s. This includes reuse, innovation, and possibly eliminating non-value-added work. With this method, the program has to weigh the level of potential risk involved with these choices. Make sure that this does not drive a “run to fail” mode on the program. Ensure that tasks are meeting the full requirements and scope.”
Here we really need to be careful. In some cases, we might be working with specifications or requirements that demand a certain approach and cannot be changed or waived. Then we need to ask the question, “If there is a better way, why didn’t we assume that in the first place?”
In some cases, we might find this approach fits in with opportunity management. Maybe there is new software or a new machine available that can speed things up and still get things done correctly. We have all been in that situation; just remember the last time you went through a Windows upgrade. Did that go smoothly for you?
In the area of software in particular, we must be aware of the entire ecosystem of tools we use and consider that any new tool applied in a hurry can result in problems. Case in point: one large contractor shifted from 2D drawings to 3D models to speed up and improve the processes, however not all the key suppliers were able to receive and use 3D models. The supply chain broke. Mom and Pop at the M&P Shop could not understand the new work orders.
- Focused Work.
The guide describes focused work like this: “This technique employs the program management team to help in reducing multitasking and to remove barriers for the personnel on the program that are working critical and near critical program tasks. This method requires the program culture to adapt and “protect the critical/driving path” and to support the people that are working those efforts. This also requires the program manager to perform daily barrier resolution.”
A discussion on multi-tasking might be fun here, but we will assume for this blog that multi-tasking pulls resources away from tasks to do other selected tasks and that is not always the best approach. The big question here is what happens to the other efforts on the project when we focus on certain tasks. This technique can work well but only if we are aware of the impact to the other work and manage that work as well. Risk can be increased by adopting this approach so be alert. If we really are just removing barriers then we can benefit from this method. If we are just pushing aside other efforts to concentrate on this one, we need to know that and handle all the work properly.
- Calendar Adjustment.
The guide tells us, “This technique accelerates the plan by changing the amount of working hours available each day or working days available each week. This method is possible only if the resources and task location support working the increased work periods. Attention needs to be put on resource de-confliction to ensure resources are not over allocated.”
This is possibly the most attractive technique. Who has never had to resort to overtime to get something done? It is common to work extra hours, even over some weekends to get back on schedule. To a schedule practitioner, the calendar adjustment wording refers to the calendar in the scheduling tool and how it can be changed to add time in a day or convert non-working days to working days.
This approach is not free. Overtime costs more than regular time and added shifts bring added costs. You should be aware you need to make a trade-off to determine whether the cost can be justified.
- Delay or Descope.
The guide advises, “If other techniques are not a viable option and the resultant schedule delay impact is unacceptable, an option exists to propose delaying or removing the selected scope.”
Notice the use of the word “propose.” Working on a contract may not afford the opportunity to eliminate work or consciously delay work. Coordination with the customer is required. Depending upon the customer’s immediate needs, they may be willing to take a more flexible approach to which work scope items can be delivered in a given time frame when they need to deploy something quickly.
The PASEG goes on to tells us about things to promote and things to avoid. Those discussions are informative and useful. You are encouraged to obtain a copy of the PASEG and learn more on your own. More than that, you are encouraged to use this terminology and spread the use of it so that adoption spreads.
Interested in learning more? The H&A Three Day Project Scheduling Workshop includes content on schedule acceleration techniques as well as managing schedule risk. This is a standard public workshop. Many of our clients schedule an in-house workshop that is specific to the scheduling tools they use such as Microsoft Project or Oracle Primavera P6. Call us today to get started.
Survey of Schedule Acceleration Techniques Read Post »