EVMS

Including Level of Effort (LOE) in the Integrated Master Schedule (IMS)

, , ,

A recent H&A blog titled “Level of Effort (LOE) Best Practice Tips” discussed different approaches for handling LOE to avoid generating false variances. That discussion did not elaborate on including the LOE tasks in the integrated master schedule (IMS). This blog is a follow on to that earlier discussion with a focus on options for including LOE in the IMS along with notes on best practices, tips, and customer expectations.

In the general sense of an earned value management system (EVMS), the LOE scope of work is contained in summary level planning packages (SLPPs) or control accounts as subordinate planning packages or work packages. The budget values for those elements will most likely come from a resource loaded IMS or a resource loading mechanism aligned with the IMS. Not all organizations resource load the IMS activities but instead extract time buckets from the IMS for resource loading using other mechanisms. Resource loading the IMS activities is the recommended practice because it assures cost/schedule integration, but it can be difficult.

LOE work might not appear in the IMS since it is considered optional by some customers such as the Department of Defense (DoD). The Department of Energy (DOE) requires LOE tasks to be included so you can expect it to be in the IMS when DOE is the customer.

Before we talk about LOE in the IMS we must think about the type of work the LOE tasks represent. LOE might be a general task such as “Control Account Management” that is not directly related to other work except perhaps in the time frame in which they happen. But some LOE tasks such as support tasks are related to other discrete work. Modeling the LOE in the IMS starts by understanding what type of effort is involved and can help to determine the approach for linking activities. 

LOE Best Practice Tips Related to the IMS

The Level of Effort (LOE) Best Practice Tips blog included these points related to the IMS:

  • “When LOE activities are included in the schedule, they should not drive the date calculations of discrete activities in the integrated master schedule (IMS). They should also not appear on the critical path.”
  • “LOE must be segregated from discrete work effort. In practice, this means a work package can only be assigned a single earned value method.”
  • “Consider shorter durations for the LOE when that LOE is supporting discrete effort. Should the first occurrence of the LOE trigger a data anomaly test metric, it can be proactively handled along with any future replanning. The remaining LOE would already be in one or more separate work packages so there won’t be any criticism for changing open work packages.”

Government Agency and Industry Guidance on LOE on the IMS

Is there any guidance that can help clarify how best to handle LOE tasks in the IMS? Let’s take a look at three of the guidance documents that may be useful for your environment.

  1. The Integrated Program Management Data and Analysis Report (IPMDAR) Data Item Description (DID), DI-MGMT-81861C (August 2021). This DID is typically placed on contracts with the DoD or NASA that exceed the contract value threshold for EVM reporting or EVMS compliance. Relevant mentions of the data requirements for the IMS in the DID are as follows.

“2.4.1.1 Content. The Schedule consists of horizontally and vertically integrated discrete tasks/activities, consistent with all authorized work, and relationships necessary for successful contract completion.”

Note: This is where the option to exclude LOE from the IMS appears since this requires only discrete tasks/activities. The following sections provide additional guidance when LOE is included in the IMS.

“2.4.2.7 Level of Effort (LOE) Identification. If tasks/activities within an LOE work package are included in the Schedule, clearly identify them.”

“2.4.2.9 Earned Value Technique (EVT). Identify the EVT (e.g., apportioned effort, level of effort, milestone).”

  1. National Defense Industrial Association (NDIA) Integrated Program Management Division (IPMD) Planning and Scheduling Excellence Guide (PASEG) (Version 5.0). The PASEG is a widely recognized industry guide on scheduling best practices in government contracting environments. Section 5.8, Level of Effort (LOE) provides a discussion on the topic including things to promote and things to avoid. Excerpts from the PAGEG follow.

“There are pros and cons around including or excluding LOE tasks in the IMS. Including LOE tasks in the IMS allows for a more inclusive total program look at resource distribution, which aids in the maintenance and analysis of program resource distribution. However, if modeled incorrectly, including LOE tasking in the IMS can cause inaccurate total float and critical path calculations.”

“Tasks planned as LOE in the IMS should be easily and accurately identifiable. This includes populating the appropriate Earned Value Technique field (as applicable) and possibly even identifying the task as LOE in the task description.”

“Consider adding an LOE Completion Milestone to tie all LOE tasking to the end of the program.”

“LOE tasks should not be networked so that they impact discrete tasks. Incorrect logic application on LOE can lead to invalid impacts to the program critical path.”

“Level of Effort tasks should have no discrete successors and should therefore never appear on critical/driving paths.”

  1. DOE Guide 413.3-24 Planning and Scheduling (April 2022). This document provides guidance for acceptable practices in a DOE contractual environment. The discussion on LOE can be found in Section 7 Planning and Scheduling Special Topics, 7.2 Level of Effort, and 7.3 Inclusion of Level of Effort in the Integrated Master Schedule. Excerpts and image from the Guide follow. 

“Overview: Activity-based methods either cannot, or impracticably can measure the performance of LOE WPs and activities. Include all activities, both discrete and LOE, in the IMS.”

“LOE is planned in the IMS so that it does not impact discrete work. Figure 6 shows the recommended linkages in the IMS for planning level of effort.”
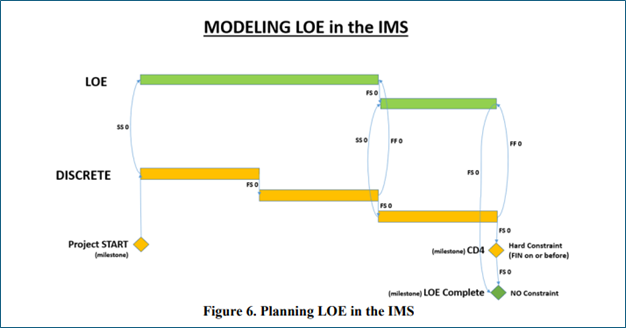
Interpreting this DOE Guide diagram for the recommended modeling of LOE in the IMS, notice the inclusion of a “LOE Complete” milestone following the Critical Decision (CD) 4 milestone with no constraint. CD4 in this diagram represents the end of contract effort. The purpose of this LOE-complete milestone, with no constraint, is to provide a successor for all LOE tasks where one is needed. That will prevent generating issues where tasks have no successors.

This recommended modeling is done so that the LOE tasks are not linked to the end of the contract work and thus will not push it. The LOE tasks will also not appear on the critical path since they are not in the path that established the end date.

Also note that the LOE tasks in green are linked as successors to discrete work which is a logic linking approach intended to keep the LOE work aligned with the discrete work but off the critical path. Study the logic and you see that a movement to the right of a discrete task will drag along its related LOE task.

DOE requires the use of Primavera schedule tools so the relationships shown here can be accomplished in that tool. That may not be true of all tools. Know how your tools work before you generate any guidance.

Additional Relevant Guidance Search

H&A earned value consultants recently conducted a survey of the various government and non-government documents regarding the IMS and collected relevant guidance related to LOE among other things. The table below lists the results from a search for “LOE” wording. Note: this is a representative sample of typical government agency and industry IMS references. You should verify current references before you generate your own internal IMS guidance.

Source DocumentGuidance for Capturing all Activities, LOE in IMS
DCMA EVMS Compliance Metrics (DECM) Checks (version 6.0)
  • 06A210a: Do LOE tasks/activities have discrete successors? (0% threshold)
  • 12A101a: Are the contractor’s Level of Effort (LOE) WPs supportive in nature and/or do not produce technical content leading to an end item or product? (≤ 15% threshold)
  • 12A301a: Does the time-phasing of LOE WP budgets properly reflect when the work will be accomplished? (≤ 10% threshold)
IPMDAR DID DI-MGMT 81816CIf tasks/activities within an LOE work package are included in the Schedule, clearly identify them.
DOE Guide 413.3-24 Planning and Scheduling, Appendix A Schedule Assessment PrinciplesPrinciple 20. No LOE on critical path.
GAO Schedule Assessment Guide: Best Practices for Project Schedules (December 2015)Selected excerpts:
  • LOE activities should be clearly marked in the schedule and should never appear on a critical path.
  • LOE activities … derive their durations from other discrete work.
  • Best Practices for confirming the critical path is valid: Does not include LOE activities, summary activities, or other unusually long activities, except for future planning packages.
NDIA IPMD PASEG (version 5.0) (as noted above)
  • Tasks planned as LOE in the IMS should be easily and accurately identifiable.
  • LOE tasks should not be networked so that they impact discrete tasks.
  • Level of effort tasks should have no discrete successors and should therefore never appear on critical/driving paths.
PMI Practice Standard for Scheduling (Second Edition)Since an LOE activity is not itself a work item directly associated with accomplishing the final project product, service, or results, but rather one that supports such work, its duration is based on the duration of the discrete work activities that it is supporting.

Conclusion

Based on the various sources of guidance, it is possible to structure the IMS to include LOE in a way that provides cost/schedule integration and keeps all work correctly aligned yet does not cause issues with the critical path and the driving paths. From this guidance, it should be a straightforward effort to generate your own internal scheduling procedure defining how to handle LOE in the IMS if you choose to include it or if you are required to include it.

Need help producing a clear and concise scheduling procedure or tool specific work instructions? H&A earned value consultants and scheduling subject matter experts have worked with numerous clients to create easy to follow guides that help to ensure schedulers are following your company’s best practices using the scheduling tools of choice. Call us today at (714) 685-1730 to get started. 

Including Level of Effort (LOE) in the Integrated Master Schedule (IMS) Read Post »

EVM and Unified Risk Management

, , , ,

Working with numerous clients, H&A earned value consultants have observed many instances where project management teams consider the risk and opportunity (R&O) management process to be something technical in nature, run by engineers and focused on the technical aspects of the project’s product. Meanwhile, there is often a separate risk process going on much less formally to consider risks in terms of the project’s schedule and cost goals. This bifurcated approach is a source of risk itself.

Procuring agencies such as the DoD, NASA, DOE, and others have published their own risk management guides. The Government Accountability Office (GAO) has various reports on this topic including examples of their findings. DCMA mentions risk in their Business Practice 4  Guideline Evaluation Template (GET) Process/Implementation Verification Points often used by contractors to check whether their earned value management system (EVMS) meets the intent of the EIA-748 Standard for EVMS guidelines. The exact questions asked by DCMA are important but the overall idea that risk and EVMS are co-dependent is the critical aspect. This is also true for the DOE. They identify risk management as one of the 10 subprocesses necessary for an EVMS.

Setting the Stage

Risk is defined as a factor, element, constraint, or course of action that introduces an uncertainty of outcome that should it occur, could negatively impact the ability to meet the project’s planned technical, schedule, or cost objectives. Negative impacts are sometimes called a threat where the objective is to mitigate the risk. A realized risk becomes an issue that must be resolved to minimize the impact. An opportunity is defined as a positive risk where the objective is to capture the beneficial impacts. Opportunities are not as common as threats.

R&O management is defined as the process of identifying, assessing, and responding to risks and opportunities throughout the project’s life cycle. The goal of R&O management is to identify potential risks and opportunities, determine the likelihood or probability the risk or opportunity will occur, and determine the impact should a risk be realized, or an opportunity is captured. Risks and opportunities are prioritized so that those with greater impact and a higher probability of occurring receive a greater share of resources and attention.

In this blog, we are using the term risk with a focus on the negative impacts or threats to a project.

Example of Common Project Risks and Risk Assessment Approach

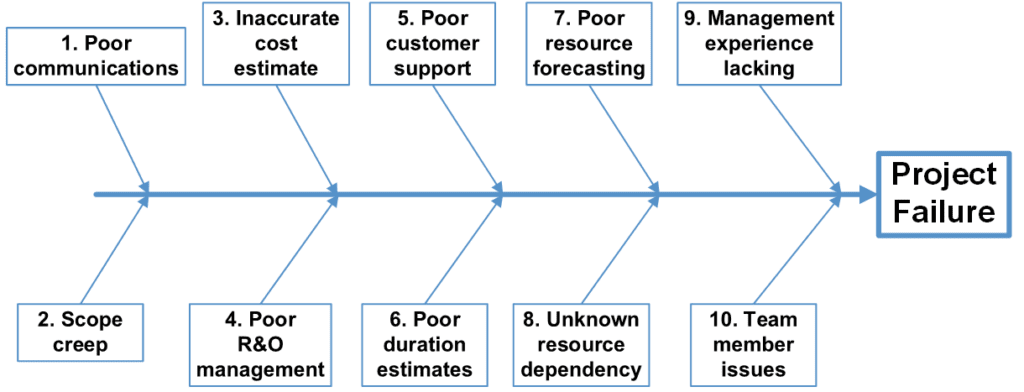
H&A’s senior management routinely reviews literature, considers our work with clients, and discusses with our earned value consultants the main contributors to project failure. These findings are updated regularly and presented in H&A training materials as an Ishikawa Fishbone Cause and Effect diagram. Figure 1 is an example of this type of diagram. 

Figure 1: Example of an Ishikawa Fishbone Case and Effect Diagram

Figure 1: Example of an Ishikawa Fishbone Case and Effect Diagram

When this approach is used for risk assessments, each contributing risk is assessed, and the response documented. An example of a risk/response table is shown below for the first three identified risks.

Risk ItemGood Example of a Real Project Response to an Identified Risk
Poor communicationsGoals are known and documented. Communications plan is in place. Have an established cadence for weekly internal and customer meetings to quickly resolve issues. An internal project performance management dashboard is updated daily with current data. Updated IMS and risk register are broadcast weekly to the team. A strong business rhythm has been established.
Scope creepWork scope (requirements and SOW) are well defined and a change control process is in place. Performers are trained in spotting scope creep and how to handle potential changes in scope.
Inaccurate cost estimateImplemented a process enabling cost estimators to search historical actual cost data, identify analogous tasks, substantiate, and document the basis of estimate. For high risk areas, techniques such as the Delphi method, SMEs, and non-advocate reviews are used. Performance is constantly monitored to spot work elements where the actual costs do not align with the budgeted costs or the estimate at completion (EAC) is triggering internal variance at completion (VAC) thresholds. 

This same type of approach can be used by the project control team to create risk Ishikawa diagrams to identify technical risks that could impact the ability to achieve schedule and cost goals. Likewise, risk Ishikawa diagrams can be used to identify risks in the integrated master schedule (IMS) and time phased budget or estimate to complete (ETC) and EAC.

A Unified Approach to Risk

A unified approach includes technical, schedule, cost, and other risk identification and assessment that is an integral part of a contractor’s EVMS. R&O management should be integrated into the EVMS subsystems including work organization, planning and scheduling, work authorization and budgeting, management analysis and reporting, and change management. 

Identified risks are analyzed and quantified to develop a risk handling strategy. Where applicable, risk mitigation tasks have been entered into the IMS. Ideally a schedule risk assessment (SRA) has been completed to gain an understanding of duration risks that can help to improve the accuracy of the schedule. Assuming the IMS is resource loaded and leveled, the result is a more accurate time phased budget plan as it incorporates the risk handling strategies when the performance measurement baseline (PMB) is established. The R&O process also provides the necessary rationale for determining the budget amount set aside for management reserve (MR).

The R&O assessments should be a normal part of generating the Variance Analysis Reports (VARs) and updating the ETC and EAC. These assessments can also drive the need for processing baseline change requests (BCRs) as well as determining the best approach for corrective actions. 

Using Directed Searches of Identified Risks

To facilitate a unified approach, we recommend establishing a cadence of standing risk review sessions that are conducted in a methodical way to ensure the project manager, integrated product team (IPT) leads, control account managers (CAMs), schedulers, and financial analysts routinely walk through the identified risks that have the potential to impact the project’s IMS or time phased cost.

The intent is to establish a framework such as Ishikawa diagram to guide the risk review session, a directed search of the identified risks should anything further need to be addressed. It is important that a “does anyone have a risk to suggest” approach is not used. Every topic should be covered in every session by walking the Ishikawa risk items. Most of the time it will be a quick “no change” response. Separate Ishikawa diagrams could be used to guide the discussions for the contributing technical, schedule, and cost risks. The meeting room should have the ability to view the live IMS, cost data, and performance analysis data. Team members should be prepared to take notes during the meeting to compile action items.

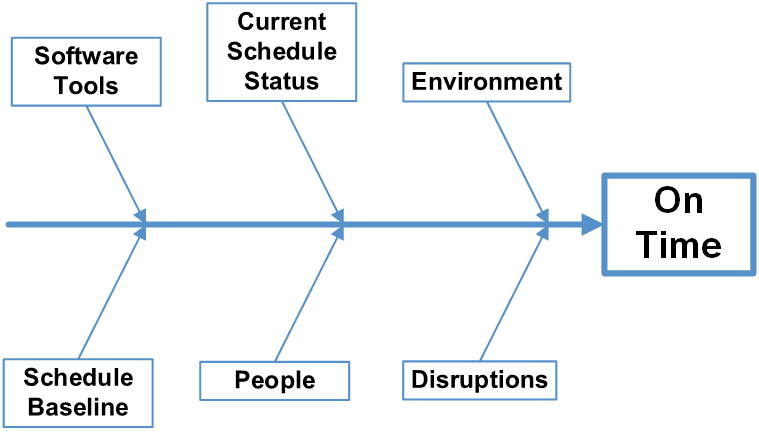
Figure 2 is an example of a basic Ishikawa diagram of IMS risks the project control team could focus on for the risk review session. This would reflect the project control team’s identified risks to the IMS they routinely monitor.

Figure 2: Example of an IMS Ishikawa Fishbone Case and Effect Diagram

Figure 2: Example of an IMS Ishikawa Fishbone Case and Effect Diagram

For example, updating the current schedule every reporting period has the potential to compromise the integrity of the IMS to provide accurate forecast information about the project’s remaining work. Perhaps the project control team has identified a list of contributing schedule status risks, risk response, and example directed questions for each review meeting. These questions could be focused at the CAM level. The following table is a simple example. 

Risk ItemRisk ResponseExample Directed Questions
IMS critical or driving pathsVerify logic. Verify traceability exists and has not been damaged by updates. Review constraints, deadlines, and milestones. Perform data quality check, correct errors.Did milestones move? Did the end date move? What were the baseline dates for starts or finishes that fall into the period?What were the forecasted dates for starts and finishes that fall into the period?What did not happen? Why?
RealismCalculate and assess the Baseline Execution Index (BEI) and Current Execution Index (CEI). Compare the ratio of actual performance to the ratio of future performance.Is the BEI/CEI result within goals? Are there performance discrepancies? Does the forecast need to be updated to align with reality? Is the forecast showing the performance the team can achieve based on what has been achieved?
Quality of ETC/EACVerify updates are occurring. Compare current ETC/EAC to previous ETC/EAC.Has the ETC been updated? What changed and why? For example, for activities with material requirements, price or usage variances may impact the ETC/EAC. For activities with labor requirements, availability or personnel changes may impact future work effort ETC/EAC.

The same approach would be used for guided budget and cost risk discussions. Tailored cause and effect diagrams should be created for a company business environment and each project’s unique characteristics.

Interested in learning more?

H&A’s training courses purposely include content on R&O management and integrating it into the EVMS. H&A’s Project Scheduling as well as Advanced Earned Value Management Techniques (AEVMT) workshops in particular include more discussion on R&O topics.

A company’s EVMS should be designed to aid the identification and management of risks and opportunities. For example, during the process of developing the schedule and budget baseline, activity durations, resource requirements, and budget distribution can be refined to reflect identified and assessed risks. Proactively identifying and managing risks improves project performance. The expectation of specific risks occurring leads to contingency plans that lower the likelihood and impact of risks as well as the establishment of schedule margin and MR to address identified and assessed risks.

Call us today at (714) 685-1730 to get started.

EVM and Unified Risk Management Read Post »

Incorporating IMS Information Directly into Independent Estimate at Completion (IEAC) Formulas

, , , ,
Incorporating IMS Information Directly into Independent Estimate at Completion (IEAC) Formulas

“When you need to discuss the schedule, look at the schedule.”

– A Scheduler’s Lament

There are many existing formulas for calculating an Independent Estimate at Complete (IEAC) from earned value data. A recent study of a sample of projects found that the calculated IEACs analyzed at the 25%, 50%, and 75% complete points were not accurate when compared to the final actual cost of work performed (ACWP). The following table lists the thresholds used to assess the accuracy of the IEACs at the different complete points for the sample projects.

Percent CompleteAccuracy Threshold
25%Within +/- 10% of final ACWP
50%Within +/- 7% of final ACWP
75%Within +/- 5% of final ACWP

While working on that study of the accuracy of commonly applied IEAC formulas as well as on a small project as an analyst for a customer, the idea for using data directly from the integrated master schedule (IMS) in conjunction with the cost performance data to create a new IEAC formula emerged.

Using Data Directly from the IMS to Calculate an IEAC

It should be noted that none of the generally used IEAC formulas use data directly from the IMS. The IEAC formulas use data found in the cost performance portion of the earned value monthly reports to customers.

IMS data is only used indirectly in the IEAC formulas. When a task is started and progress updated, the earned value (the budgeted cost for work performed or BCWP) is developed from the progress reported. This is measured against the cost baseline (the budgeted cost for work scheduled or BCWS).

At the same time, in the IMS environment, the schedule analysts are calculating the Baseline Execution Index (BEI) for task completions/finishes. BEI (for finishes) measures how many of the tasks baselined to be completed by the cut-off date were completed. If all the tasks were done (BEI = 1), their value would have been earned. Of course, other tasks could have started, progressed, and maybe even finished. For this example, the Schedule Performance Index (SPI) calculated at that point (BCWP/BCWS) should be at least 1 and potentially higher. The SPI reflects the baseline value of completed tasks plus the in-process claimed baseline value. The in-process claimed value can be subjective in some cases.

The argument, if there were one, might be there is no need to try and include BEI or similar schedule measures in the IEAC formulas since they already include SPI.

However, there is a whole different and unique set of information coming from the IMS that is not currently used in the IEAC formulas. That information is what we chose to call “Duration Performance” and “Realism Ratio.” These are measures of the actual duration for completed tasks and the forecast duration for future tasks.

Calculating Duration Performance

The IMS data includes the baseline number of days assigned to each task as well as the actual number of days to complete each task. If a task is baselined to take 10 days (Baseline Duration = 10) and the task took 15 days to complete (Actual Duration = 15) then it is taking 150% of baseline to do the work.

This is similar to the Cost Performance Index (CPI) that uses the BCWP and the ACWP to determine how efficient the work performance has been. The formula BCWP/ACWP shows how the work accomplished compares to the cost of that work performed.

If we assume, for labor at least, that taking longer to complete a task often leads to costing more than baselined, we can use the Duration Performance to develop an IEAC.

To develop the Duration Performance, we would use the IMS from the month being analyzed to perform the following actions:

  1. Filter out all summary tasks and look only at real work tasks.
  2. Decide what to do with level of effort (LOE) – keep it or ignore it.
  3. Filter for all tasks that are completed (100% complete).
  4. Add up the baseline duration in days for all these completed tasks.
  5. Add up the actual duration days for these same completed tasks.
  6. Compare the actual duration days used to the baseline duration days.

An example would be:

  • 100 completed tasks
  • Total baseline days duration = 1,000
  • Total actual days duration = 1,500
  • Duration Performance = 1,000 / 1,500 = .67

One of the common IEAC formulas is the “SPI times CPI” that is calculated like this: ACWP + Budgeted Cost of Work Remaining (BCWR) / (CPI x SPI) where BCWR = Budget at Completion (BAC) – cumulative to date BCWP.

Now that we have a duration performance factor, we can develop a new IEAC. The Duration Performance IEAC would be done using the CPI from the same month as the IMS where ACWP + BCWR / (CPI x Duration Performance Index).

Using some actual data from a project for a single month we see:

  • Duration Performance Index = .82
  • BEI = .72
  • CPI = .92
  • SPI = .94 (significantly higher than the BEI)
  • ACWP = $9.2M
  • BCWR = $18.3M
  • IEAC using standard formula with CPI x SPI = $9.2 + $18.3 / (.92 x .94) = $30.3M
  • IEAC (Duration Performance) = $9.2 +$18.3 / (.92 x .82) = $33.5M

Assessing the Realism Ratio

When we look at the remaining tasks to be completed, we can use the Realism Ratio to assess how the future forecast durations compare to the performance so far.

The data needed are the baseline duration and the forecasted duration for all tasks that have not been started. This concept excludes in-process tasks. In our example from before, the data we created looked like this:

  • 100 completed tasks
  • Total baseline days duration = 1,000
  • Total actual days duration = 1,500
  • Duration Performance = 1,000 / 1,500 = .67

We would use the same IMS to do this:

  1. Filter out all summary tasks and look only at real work tasks.
  2. Decide what to do with LOE – keep it or ignore it.
  3. Filter for all tasks that are not started.
  4. Add up the baseline duration in days for all these tasks not started.
  5. Add up the forecasted duration days for these same tasks not started.
  6. Compare the forecasted duration days to the baseline duration days.

Let’s say there were 100 tasks not started. If the forecasted days were 1,000 and the baseline days were 1,000 that would yield 100%. When we did the example, the Duration Performance was .67. This means that performance to date was .67 but the future will be 100% or 1. You can see the disconnect. That disconnect we call the Realism Ratio (in this example, .67/1).

Data from the actual project for the same month as discussed earlier shows:

  • Duration Performance = 122% of baseline
  • Future Performance = .86 or 86% of baseline.

This means that the future durations are cut significantly.

We would use this data to develop a factor called a Realism Ratio (86/122 = .70) and that would be used to develop an IEAC using this formula: IEAC (Realism Ratio) = ACWP + BCWR / (CPI x Realism Ratio).

Using the same sample project data from above and adding in an assessment of the forecasted durations for the remaining work, we see:

  • Duration Performance = .82
  • BEI = .72
  • CPI = .92
  • SPI = .94 (significantly higher than the BEI)
  • ACWP = $9.2M
  • BCWR = $18.3M
  • Realism Ratio = .70
  • IEAC using standard formula with CPI x SPI = $9.2 + $18.3 / (.92 x .94) = $30.3M
  • IEAC (Duration Performance) = $9.2 +$18.3 / (.92 x .82) = $33.5M
  • IEAC (Realism Ratio) = $9.2 +$18.3 / (.92 x .70) = $37.6M

The project is not complete, so the final ACWP position is not known. There is a dramatic difference between the three IEACs. The difference between BEI and SPI indicates that in-process tasks and other factors such as LOE are potentially affecting SPI.

What can we learn from this sample project?

In this example, additional investigation is warranted. There are potential issues with the realism of the baseline and current schedule that are signaling a cost growth issue is likely to occur. Relying on just the time-phased cost data for IEAC calculations may not be sufficient to assess whether a contractor’s range of EACs included in their monthly cost performance reports are realistic. For more discussion, see the blog on Maintaining a Credible Estimate to Completion (EAC) and the blog on Using EVM Performance Metrics for Evaluating EACs.

Are there lurking cost growth surprises in your projects? You may want to consider revisiting your estimate to complete (ETC) and EAC process to verify there is an integrated assessment of the schedule and cost data to identify potential disconnects. H&A earned value consultants can provide an independent assessment of the quality of the data as well processes and procedures to help you verify your EACs are realistic. Call us today at (714) 685-1730.

Incorporating IMS Information Directly into Independent Estimate at Completion (IEAC) Formulas Read Post »

Establishing a Robust EVMS Self-Governance Process

, , ,
Establishing a Robust EVMS Self-Governance Process

A previous blog, Benefits of an EVMS Self-Governance Process, discussed why establishing a self-governance or self-surveillance process is important and how an effective process builds confidence with the customer. With a structured and repeatable process in place, effective self-governance demonstrates management’s commitment to maintaining the EVMS and open communications with the government customer. Self-disclosure and quickly addressing EVMS compliance issues are essential.

H&A earned value consultants often assist contractors to implement a robust self-governance process as their level of EVMS maturity increases over time. This blog highlights how H&A provides support and technical expertise to help a DOE contractor to do just that.

Developing the Self-Governance Process and Tools

H&A is a strong teammate in the development and implementation of a robust EVMS self-governance process for TRIAD at the Los Alamos National Laboratory (LANL). TRIAD is the prime contractor that provides laboratory management and operations for LANL. H&A is involved in developing tools, refining processes, establishing business rhythms, and summarizing data necessary to support the implementation of a leading-edge EVMS self-surveillance capability. The H&A team is also instrumental in developing the tools necessary to analyze, review, and act on the monthly data set TRIAD provides to the DOE EVMS compliance team.

These tools generate the DOE EVMS compliance metrics (automated and manual) in accordance with the DOE EVMS Metric Specification to ensure TRIAD is able to view the data the same way as their DOE counterparts. Once the tools generate the DOE EVMS compliance metrics, the results are passed to the TRIAD System Surveillance Officers (SSOs) to review and confirm flagged items are either actual fails or exempted/justified based on the rationale captured in the tool. For failed metrics, the SSOs and the project teams use the source data from the tool to identify the root cause and proactively correct EVMS compliance issues. Each month the EVM compliance data is collected across projects, summarized, and graded at the TRIAD level, and then gathered into an EVMS compliance dashboard for TRIAD leadership review and action.

Monthly Self-Surveillance Process

The monthly self-surveillance process includes the following activities.

  1. For each project, the tool generates the automated metrics from the DOE compliance flat files and then collects the results of manual testing into a single file with all 183 DOE metrics. This tool enables an SSO to review the flags, access the source cost and schedule data, apply exemptions/waivers, and then share the data with the project team to resolve issues. By trending this data across the project’s life cycle and capturing SSO exemptions and monthly actions, the team can analyze the data, determine root causes, address issues, and capture historical EVMS compliance actions in one place.
  2. An EVMS summarization tool then collects the results from each project and rolls the lower-level results into a summary TRIAD level. Each metric grade (Pass/Fail/Caution) considers weighted EVMS performance across multiple projects to ensure grading is aligned with the exit criteria for the DOE corrective action plans. In addition to TRIAD level grading for each metric, the summary tool also rolls up the metrics to the 10 EVMS Maturity Subprocess areas and 56 Attributes of an EVMS which is documented in the Compliance Assessment Governance (CAG) Appendix to the DOE EVMS Compliance Review Standard Operating Procedure (ECRSOP). This summarization tool provides the subprocess area and attribute grading at both the project and TRIAD levels. By viewing the data across projects and time, the EVMS core team can quickly identify systemic or project level issues.
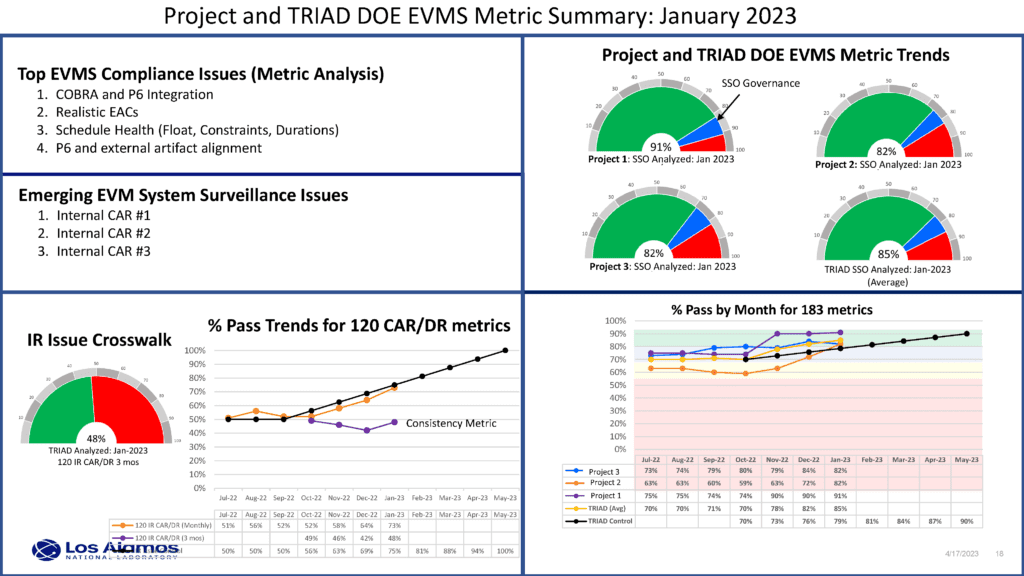
  3. A set of tailored EVMS compliance summarization metrics is presented in a “dashboard” configuration for the EVMS core group and senior leadership to review. Leadership uses this summary data to determine where they need to dive deeper into the data and whether TRIAD is meeting their EVMS compliance targets.

Figure 1 illustrates this management level dashboard view. 

Figure 1: Example of the Summary Level Compliance Metrics Across Projects

Figure 1: Example of the Summary Level Compliance Metrics Across Projects

  1. The team also developed and uses a flat file analysis tool that is aligned to the DOE data integrity and quality checks (DIQs). This tool is used for projects transitioning into DOE Critical Decision (CD) Milestones 2 or 3 execution phases that require submittals to the DOE Project Assessment and Reporting System (PARS). This tool ensures the project flat files meet the DOE data quality standards. Like the 183 metrics tool, the flat file tool enables analysts to isolate data quality issues, review the source data, and then determine and track how the team will resolve or justify each issue. In addition to preparing for PARS submittals, these DIQ assessment metrics are also generated monthly to help assess on-going system integration integrity.

Establishing a Best-in-Class Self-Governance Process

In addition to supporting the monthly self-surveillance process, these tools and processes are instrumental in supporting the active surveillance portion of TRIAD’s self-governance efforts. The active surveillance team uses the same tools to summarize and review the “data call” sets in preparation for their reviews. Just like their DOE counterparts, the TRIAD active surveillance team analyzes the 183 DOE compliance metrics to focus their inquiries and document review findings. The H&A team was instrumental in planning, executing, and closing out the recent TRIAD active surveillance that was observed and lauded by the DOE EVMS compliance team.

By supporting the design, development, planning, and execution of all facets of a leading-edge DOE self-governance process, the H&A team helped to ensure our LANL customer has the robust EVMS compliance capability necessary to meet the rigorous DOE EVMS compliance requirements.

As this case study demonstrates, with H&A’s help, TRIAD successfully implemented a structured and repeatable self-governance process with analysis tools that capture objective measures and metrics to actively demonstrate compliance and issue resolution to their customer.

H&A earned value consultants can do the same for you. Call us today at (714) 685-1730 to get started. 

Establishing a Robust EVMS Self-Governance Process Read Post »

Benefits of an EVMS Self-Governance Process

, ,

Contractors with a cognizant federal agency (CFA) approved or certified Earned Value Management System (EVMS) are expected to establish and execute an annual EVMS self-governance plan. Sometimes also called self-surveillance or self-assessment, the objective is the same. The contractor is responsible for establishing an internal process to ensure their EVMS, as implemented at the contract/project level, continues to:

  • Provide valid, reliable, and auditable information for visibility into technical, schedule, and cost progress with fact-based performance analysis. Project personnel have timely information about actual conditions, trends, and potential problems to implement effective corrective actions.
  • Maintain the integrity of the performance measurement baseline (PMB) for measuring completed work and to manage the remaining work.
  • Comply with the EIA-748 Standard for EVMS guidelines.

Equally important, the contractor is responsible for ensuring project personnel are:

  • Following the process and procedures described in their approved EVM System Description.
  • Establishing and maintaining quality schedule, cost, and risk/opportunity data.
  • Routinely using the EVMS (process, procedures, and tools) and EVM data to proactively manage their work effort.

Why is a self-governance process important?

With an established self-governance process and data-driven analytics, a contractor can objectively demonstrate to their customer that EVM and the use of EVM data is an integral part of their project management process. Establishing a culture of self-disclosure of issues and resolution ensures the EVMS is actively maintained, and project personnel understand the importance of their role in implementing the EVMS. Everyone must have confidence in the EVMS to provide timely, relevant, and actionable information to effectively manage and control projects.

An effective self-governance process provides the structure to routinely observe and assess how the EVMS is implemented on projects. This structured process documents what is assessed and how it is assessed using defined objective measures such as data quality metrics that can be analyzed over time to track the occurrence and resolution of issues.

What are the benefits of implementing a self-governance process?

There are a number of benefits to implementing a self-governance process for the contractor as well as the government customer.

The contractor’s management benefits from increased visibility into the “health” of the EVMS. Consistently verifying the system is implemented and used as intended instills confidence. They know they can depend on the EVMS to provide timely, reliable, and actionable information for visibility and control.

Routinely analyzing the results from the self-governance activities provides fact-based information a contractor can use to implement actions that improve the EVMS process and procedures, the means and methods project personnel use to implement the EVMS, or the training methods and content. With a structured and repeatable process in place, the contractor can:

  • Quickly identify and quantify process, people, or tool issues as well as the potential impact to meeting project objectives. Early identification of a problem often helps to mitigate the impact to the project.
  • Identify the root cause of the issue. Is it a recurring theme (a systemic issue) or a unique to a single project? This helps to determine the best way to resolve the issue.
  • Determine what actions are the most effective in mitigating the impact or resolving the root cause. Measuring and verifying outcomes helps to ensure the corrective action achieves the desired result.
  • Identify best in class practices that could be used on other projects. This is often overlooked as a positive outcome of the self-governance process that encourages continuous system improvements and innovation in project implementations.
  • Provide best practice guidance and support to encourage early correction or quick resolution of implementation issues. This helps to increase project personnel proficiency levels. Knowing structured fact-based self-governance assessments are conducted helps to reinforce the message that EVM practices are an integral part of managing projects.

It also builds confidence with the customer. Implementing a process of self-disclosure and corrective actions implemented demonstrates an on-going commitment to maintaining the EVMS. It also demonstrates the willingness to maintain open communications. The benefit of this approach is that it can help to:

  • Reduce the need for onsite government customer reviews or shorten the duration of a surveillance visit. When the contractor is providing regular information about their internal process to verify the health of their EVMS and internal corrective actions, it demonstrates the EVMS is being used as intended and remains compliant with the EIA-748 guidelines.
  • Minimize disruptions to project personnel. This is a direct result of reducing the need for customer reviews. Internal self-governance activities, system or tool improvements, or training can be scheduled to avoid impacting project personnel’s ability to accomplish project objectives.
  • Ensure long-term sustainability of the EVMS. An EVMS should be continually maintained to ensure process, procedures, and tools reflect current requirements. The goal should be to take advantage of opportunities to streamline procedures, improve the quality of the schedule and cost data, upgrade tools, and enable data integration/traceability to reduce the time and effort required to manage project work effort.

What are the characteristics of an effective self-governance process?

An effective self-governance process should be visible, structured, and endorsed by management. Key characteristics and features include:

  • Leadership engagement that encourages continuous improvement and a culture of compliance.
  • Encourages issue identification and tracking with timely closure and verifiable results.
  • A chartered authority structure with cross-organizational engagement that routinely interacts with leadership. This approach develops a broader base of internal expertise and experience.
  • A data-driven methodology to routinely assess system health using clearly defined and independently positioned oversight with a clear line to senior management.
  • Effective, consistent, and defined structured approach that is repeatable and sustainable.
  • Encourages improving project personnel skill levels using proven training  and mentoring techniques.
  • Transparency and means to collect feedback, both critical and praiseworthy.

Need help establishing a self-governance process? 

H&A earned value consultants often assist clients to create and implement a repeatable and sustainable self-governance process to verify their EVMS continues to support the EIA-748 guidelines as well as to assess how project personnel are implementing the EVMS. The objective is to establish a structured process to collect fact-based information useful for creating action plans to address identified deficiencies in the EVMS, how the EVMS is implemented, data quality, or the proficiency levels of project personnel. This structured process is also used to track action plans to closure and verify results.

An industry best practice is to include the EVMS self-governance or self-surveillance process in the EVM System Description along with other artifacts such as the EVMS self-governance charter. Contractors often use government customer surveillance artifacts such as DCMA or DOE automated or manual metrics as the basis to assess the quality of their schedule and cost data as part of their self-governance or self-surveillance process.

If you need help updating your EVM System Description to include a self-governance process, or need to create a self-governance plan, call us today at (714) 685-1730 to get started.

Benefits of an EVMS Self-Governance Process Read Post »

Creating a Scalable Earned Value Management System (EVMS)

,

Creating a scalable Earned Value Management System (EVMS) is a topic H&A earned value consultants frequently encounter while assisting clients implementing an EVMS. These clients are often responding to a contractual EVMS requirement and are using it as the impetus to improve their project control system. A common theme is they would like to leverage the EVMS to win more contracts as well as increase project visibility and control to prevent cost growth surprises that impact their profit margins. They consider having an EVMS in place to be a competitive advantage.

Depending on the company size and their line of business, they typically have some project controls in place. They also realize they have gaps and processes are ad-hoc. They lack a standard repeatable process project personnel can follow. And that’s where H&A earned value consultants play a role – to help the client focus on the basics and simplify the process of implementing an EVMS that can be scaled for all types of projects.

What is a scalable EVMS?

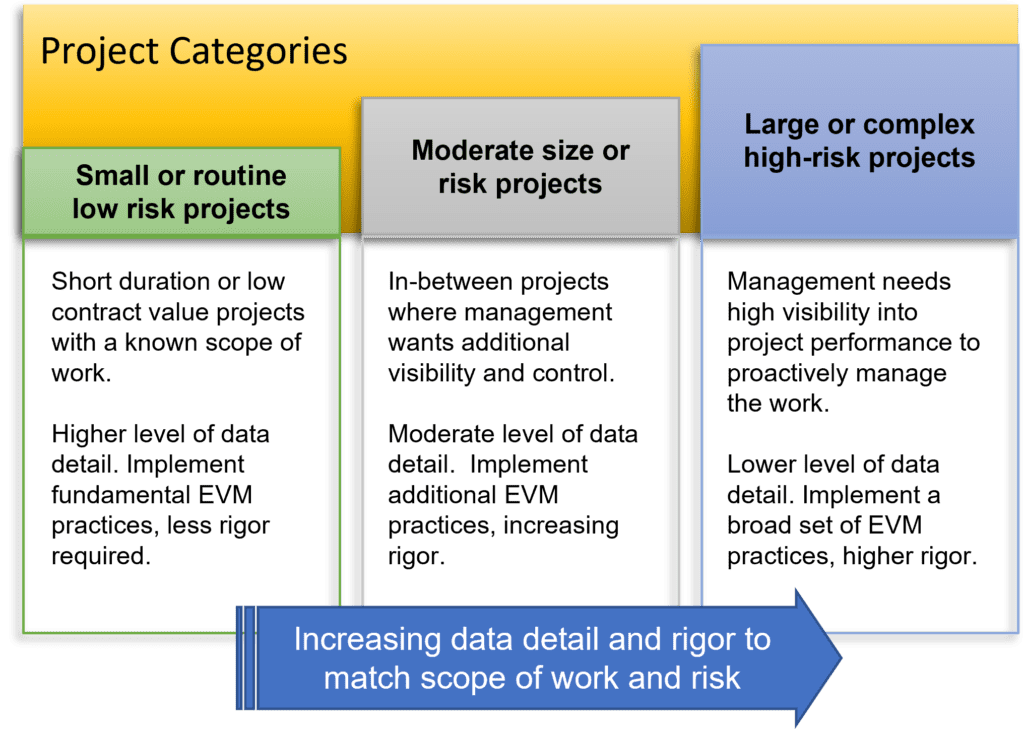
A scalable EVMS is a flexible project control system that incorporates earned value management (EVM) practices for all projects. The level of data detail, range, and rigor reflect the type or scope of work, size, duration, complexity, risk, or contractual requirements. This is illustrated in Figure 1.

Scalable Earned Value Management System Infographic - the image shows how the size of a project relates to the level of detail, amount of EVM practices and rigor we are recommending.
Figure 1 – The type of project determines the level of data detail, range, and rigor of EVM practices.

Establishing a Common Base for All Projects

The foundation for a scalable EVMS is to establish a common project control system that incorporates EVM practices. Identify which practices apply to all projects and which practices apply based on the scope of work and risk as well as the level of data detail needed for management visibility and control. Identify and quantify project attributes so it is clear what is expected.

Use this information to create guidance for project personnel so they know what is required for their project. Include this guidance in the EVM System Description.

What are the steps to create a scalable EVMS?

Step 1 – Determine the project categories.

These will be specific to your business environment. The goal is to establish a small set of clearly defined project categories as illustrated in Figure 1. Identify measurable project attributes so a project manager can easily determine their project category. An example is illustrated below.

Project AttributeSmall, low risk projectsIn-between projectsLarge, high-risk projects
Scope of workRoutine, repeatable tasks. Well defined.Mix of known and unknowns. Some requirements are well defined, others likely to evolve.High percentage of unknowns. Near term requirements are defined. TBD requirements are progressively defined.
Size (contract value is a typical measure)< $20M= or > $20M and < $50M= or > $50M
Duration< 18 months> 18 months> 18 months
Overall risk assessment, threat of schedule slip, cost growth or lower profit marginLowModerateHigh
Resource availability, skill set requirementsIn-house resources are available, able to match demandIn-house resources are available, manageable number of specialized resources that may require out-sourcing.Some in-house resources available. Must hire additional resources with specialized skill sets or out-source.
Percentage (or value range) of subcontract work effort< 30%= or > 30% and < 50%= or > 50%
EVMS FAR or DFARS clause on contract, reporting DIDNonePotential for IPMR or IPMDAR DID deliverableIncluded in contract, IPMR or IPMDAR DID deliverable

Some contractors rank or apply a weight to the attributes useful for determining the level of data detail, range, and rigor of EVMS practices required. For example, the overall risk assessment and the scope of work may rank higher than other attributes. Step 2 builds on the project categories identified in Step 1.

Step 2 – Identify the level of data detail and EVM practices that apply.

This will be specific to your EVMS, EVM System Description, and how the content is organized. Include use notes to identify practices that may not apply or what can be scaled for the project category. A simple example is illustrated below. This example assumes core EVM practices are followed for all projects such as using a work breakdown structure (WBS) to decompose the scope of work.

EVMS ComponentsSmall, low risk projectsIn-between projectsLarge, high-risk projects
WBS, WBS Dictionary, project organization, control account levelHigh level. Control accounts are larger and longer duration.Scale to match scope of work and riskLower level of detail. Depth dependent on scope of work and risk.
Work authorizationSimple workflow form and process with one or two approval levels.Detailed element of cost workflow form, additional process steps, approval levels.
Summary level planning packagesUsually not applicable.Used when appropriate for scope of work.
Work packagesLarger and longer duration. Fewer milestones, more percent complete earned value techniques (EVTs).Shorter duration. Majority of discrete EVTs use milestones and quantifiable backup data (QBDs) to objectively measure work completed.
Planning packagesOptional use.Routinely used.
Rolling wave planningUsually not applicable.Routinely used.
Network schedulesHigh level.Detailed.
Schedule risk assessment (SRA)Usually not necessary.Required. Routinely performed.
Variance thresholdsHigh level or simple.Reflect contract or project manager requirements, scope of work, or risk level.
Baseline change requests (BCRs)High level, simple log.Formal workflow process, forms, and logs to document changes and rationale. Approval levels depend on scope of the change.
Change control board (CCB)Not used. Project manager approves all changes.Required.
Risk and opportunity (R&O) managementHigh level assessment. May use simple R&O log.Formal process to assess, R&O register maintained.
Annual EVMS self-surveillanceNot applicable.Required when EVMS on contract.

Step 3 – Establish scalable templates or artifacts.

To complement the EVM System Description, provide a set of scaled templates or artifacts for project personnel. For example, a project manager for a small low risk project would select a simple work authorization or BCR form and workflow process, report templates, and logs to implement on their project. Provide a separate set of templates and artifacts for large high-risk projects that require additional procedures, data detail, workflow approval levels, forms, reports, and change tracking that can support an EVMS compliance or surveillance review.

Provide training on how to use the templates and artifacts. This helps to establish a standard repeatable process with a base set of artifacts. It also promotes a more disciplined process regardless of the type of project as personnel have a better understanding of what is required.

Another best practice is to use project directives to document the level of data detail, range, and rigor of the EVM practices implemented on a project. These provide clear direction for all project personnel on how to implement the EVMS. Project managers are often responsible for producing these. Create a template for each project category so they can easily document and communicate their management approach.

What are the benefits of establishing a scalable EVMS?

Establishing a common repeatable process along with a standard framework for organizing project scope of work, schedule, budget, and performance data enables project portfolio analysis to assess profitability. It also provides the basis to capture historical data a proposal team can use to substantiate their cost estimates. A common process eliminates the need to maintain different project control systems. It also makes it easier to move personnel between projects and increase the project control maturity level as everyone is following the same core processes – just the level of data detail or rigor of EVM practices may be different.

H&A earned value consultants have worked with numerous clients to design, implement, and maintain an EVMS. Scalability is a feature that can be designed into an EVMS and EVM System Description whether new or existing. Call us today at (714) 685-1730 to get started.


Creating a Scalable Earned Value Management System (EVMS) Read Post »

Scroll to Top