Most project failure takes root before a project ever starts, in optimistic estimates that don’t hold up against real-world execution.
The planning fallacy, hidden complexity, and weak estimating methods are the biggest drivers, and an EVMS can surface the drift but can’t fix a baseline that was never realistic.
Paul Bolinger’s full article lays out the remedies: distributional thinking, documented assumptions, the outside view, independent review, and reduced complexity where possible.
A project can have a formal schedule, an approved budget, and a fully compliant Earned Value Management System (EVMS) and still finish late, over budget, or short of the value it promised. In a new article for the H&A EVMS Education Center, Paul Bolinger looks at why that happens so often, and why it usually has nothing to do with whether the project team knows how to plan.
The short answer is the planning fallacy: the well-documented human tendency to anchor estimates on a best-case version of the work, even when past experience says otherwise. Paul traces how that bias compounds with hidden complexity between tasks, point estimates that hide real uncertainty, and in the largest, most visible projects, outright strategic misrepresentation to get an effort approved in the first place.
He’s also direct about where EVMS fits and where it doesn’t. A properly implemented EVMS is one of the most effective tools available for surfacing cost and schedule variances once a project is underway. What it can’t do is retroactively fix an unrealistic baseline. That has to happen earlier, with better estimating discipline and a willingness to use historical data instead of hope.
Read the full article, including Paul’s five remedies and a look at the “iron law of megaprojects,” on the EVMS Education Center.
Schedule Risk Assessments (SRAs) use Monte Carlo simulations to model schedule uncertainty, providing probability-based insights into meeting project completion dates and risk drivers.
SRAs enhance decision-making by quantifying outcomes (e.g., likelihood of meeting objectives), supporting risk prioritization, scenario analysis, and proactive schedule management for complex projects.
Effectiveness depends on quality inputs: well-constructed network schedules and well-defined risks.
Why perform a schedule risk assessment (SRA)?
SRAs are critical in understanding the likelihood of meeting baseline or forecasted completion dates as well as identifying which risks to focus on for protecting the project schedule.
An SRA is a Monte Carlo based simulation of the schedule using the existing logic but with different duration inputs in repeated “walk-throughs” of the schedule. In each run through of the schedule a different duration may be used for every task therefore the end date is usually different. When enough simulations are performed, a picture emerges of the distribution of potential outcomes from the shortest, to the longest, and to all those in-between.
A simple way to think of this is to imagine driving to the grocery store on the same route a thousand times. Sometimes it may be rainy or snowy or maybe even clear and dry. There may be accidents, road work, traffic lights, or other issues. Each trip can have a different duration but overall, with enough trips, we will end up with good picture of how much time we should plan for the trip. We can even have different plans for different conditions.
Of course, you do not have the luxury of performing your project a thousand times. You get one opportunity. But an SRA can help you understand what the journey through your project can look like through simulation.
Performing SRAs and managing the project based on the results can provide project managers with powerful tools to successfully meet project objectives. SRAs are a discipline that supports critical risk and schedule decision making.
Projects are often long durations of five years or more, involve one-of-a-kind systems, facilities, or integrations, and have numerous constraints ranging from security, regulatory, to environmental. In addition, these projects have oversight from organizations such as the Government Accountability Office (GAO), Office of Management and Budget (OMB), and even Congress with expectations set to meet internal milestone commitments such as critical decisions (CDs) and initial operational capabilities (IOCs). While this is a subset of the many challenges facing these projects, they all rely on project managers and the project team meeting schedule commitments.
Purposes of the SRA
The main purposes of the SRA are twofold: 1) to understand the schedule and 2) to understand the probability of achieving the end date in the schedule.
In a recent H&A workshop a very high-level executive in one of the large government agencies said of the SRA, “I don’t do it, but I receive the “P” numbers.” What she meant was that she receives the result in terms of the probability numbers developed in the SRA. She is informed of the probability of achieving the schedule as part of the program status review.
Understanding the SRA
In simple terms, an SRA is a structured probabilistic analysis by simulation of a project’s schedule that quantifies the likelihood of meeting critical dates. Initially the SRA focuses on the baseline and the probability of achieving the baselined dates. Once progress has been added to the schedule, the emphasis shifts to the current or working schedule and away from the baseline. The SRA uses the latest available information.
Uncertainty can exist in the schedule in terms of duration uncertainty, unplanned events, merge bias, and other such factors. The SRA tries to account for duration uncertainty by using a three-point approach to the task durations. The owners of the tasks are challenged to provide best case, most likely case, and worst-case durations for use in simulating the schedule.
The SRA uses the project’s schedule logic as well as uncertainty assigned to activities along with the project’s risk register to produce probabilistic outcomes. A probabilistic analysis is a way of understanding outcomes when the future is uncertain. Instead of assuming there is only one single outcome for the schedule, probabilistic analysis takes variation into account based on durations, risks, and other events through simulation. This simulation is then repeated hundreds, sometimes thousands of times to produce statistical analysis that defines what the range of results could be. This statistical analysis will reveal, based on inputs to the model, a distribution of possible outcomes with confidence intervals expressed like this:
There is a 50% chance of finishing the project by this date, or
There is an 80% chance of meeting this milestone.
The SRA can be used to evaluate an entire project schedule or a subset of the schedule which may be a specific milestone, deliverable, or even a single work package. The scope of the SRA depends upon what part or whole of the schedule you would like to examine based on application needs.
For this reason, SRAs are useful for project managers, control account managers (CAMs), schedulers, risk managers, and other key stakeholders. Stakeholders can use SRAs to meet compliance requirements, run “what-if” scenarios, or provide inputs into vendor selections and vendor performance management decisions. While the SRA is an excellent management decision tool, it should not be used to provide a static critical path review. It should never be used to create a deterministic “best-case” schedule, and it should not be dependent upon a specific software tool.
One important output of the SRA is commonly called the “Tornado Chart” because of the shape of the data provided. This analysis identifies the number of times a task acts as a driver in the outcome of the schedule. If a task is often driving the outcome, it should be considered carefully. Potential other approaches should be considered or at least a detailed review of the durations of the task should be performed.
Foundations
The SRA will only be as credible as the schedule it evaluates and the integrity of the risk information that is applied. Prior to the execution of a successful SRA, the schedule integrity should meet established quality standards.
The DCMA EVMS Compliance Metrics (DECM) specific to schedule data provides a widely accepted benchmark for evaluating integrated master schedule (IMS) health. The NDIA Integrated Program Management Division (IPMD) Planning and Scheduling Excellence Guide (PASEG) includes a section on performing schedule health assessments with a list of often used metrics. Some project teams may customize their IMS quality metrics based on their established and approved EVMS documentation. Areas typically evaluated include logic integrity, critical path integrity, schedule realism, and data quality.
Logic integrity includes the proper use of predecessors and successors with minimal usage of leads and lags and a clear path from start to finish. Critical path integrity ensures that there is an understood set of critical and near-critical paths with logical drivers of key milestones and avoidance of excessive float. Standards for schedule realism include reasonably short activity durations and a limited use of constraints. Data quality requires valid dates, calendars and status updates. All these elements are covered in the generally accepted schedule quality metrics and most SRA tools will validate the schedule as well ensure that the schedule quality is adequate to perform a successful SRA.
Equally important to the SRA is the risk information. Risks should be identified and clearly characterized; their association with the schedule should be mapped. When feasible, mitigation plans should be incorporated into the schedule along with any variations they may have. The identified risks should succinctly state the event, and the cause and effect of the risk. Each risk should be characterized by its probability of occurring and the impact to the schedule if it were to occur. This characterization should be grounded in credible assumptions, usually based on the project’s rubrics for scoring likelihood and impact.
Input of risk events into the schedule provides additional realism. In terms of the simulation there will be times when the risk event happens and times when it does not with different durations as well.
Once quality schedule and risk information is validated, these inputs are imported into the probabilistic tool used by the project team. Since probabilistic analysis is based on the Monte Carlo methodology which uses statistical math, any tool that accommodates schedule and risk inputs should be sufficient.
Frequency of SRA Application
SRAs can be expensive when time is taken to do the best case, most likely, and worst-case duration analysis by the CAMs. The cost is a limiting factor in the use of the SRA. It is most common for SRAs to be performed:
At the time of baselining to understand the baseline schedule and the probability of success.
When a major change is made to the project schedule.
Before a major event such as the Critical Design Review (CDR) where the nature of the effort changes from design to build and the team wants to understand the probability of success for the remaining effort.
Do not accept a contract that requires performing the SRA when requested by the customer. That is too open ended of a requirement and does not allow you to estimate the cost or control the cost. A contract should specify the number of SRAs to be included so that any additional SRAs can be treated as a compensated change.
Conclusion
When grounded in a high-quality IMS and integrated with disciplined risk management, SRAs provide stakeholders with a realistic view of schedule outcomes and the risk drivers. While often thought of as a compliance requirement, the SRA provides management decision insights and is useful in understanding, as an early warning indicator, any threats to meeting schedule objectives. When properly used, the SRA is a powerful management tool that can contribute to project success.Interested in learning more? H&A master schedulers and risk subject matter experts often assist clients with establishing their SRA process and mentoring project teams to use the SRA outputs to create more realistic schedules with a higher probability of success. Call us today to get started.
A budget is a project management metric used to plan and measure performance, while funds are real dollars recorded in the accounting system and spent to perform the work.
Earned Value Management distinguishes planned values (e.g., BCWS, BCWP, BAC) from actual costs and estimates (e.g., ACWP, ETC, EAC) to provide insight into project performance and funding needs.
Contract funding profiles influence how budgets are time-phased, and regular EAC analysis is essential to forecast total funding requirements and avoid breaching funding limits.
While working with numerous clients over the years, H&A earned value consultants frequently observe people using the term “money.” Typically, they mean “funds” when they really mean “budget.” People often confuse the terms, even though they have been used within the project management community long before the advent of earned value management practices.
The intention of this blog is to highlight the difference between “budget” and “funds” and promote a common understanding of the terms. Using the correct term helps to eliminate confusion and improve communication between project team members, management, and the customer.
Examples of Budget and Funds Confusion
Here are a couple of common statements H&A earned value consultants have heard many times:
I am requesting management reserve (MR) to fund my overrun.
I underran my budget, so I am going to return funds to MR.
Why are these inaccurate statements? The people making them have confused the terms or may think that “budget” and “funds” mean the same thing.
Explaining the Difference Between Budget and Funds
The simple definition is that “budget” is a project management metric, a planned value. It cannot be used as funds (i.e., money) to buy something tangible, such as a cup of coffee. “Funds” are real dollars. The purpose for budget is to measure project performance so that as funds are expended (the actual costs) to perform the authorized work, any difference, more or less than what was planned, can alert management.
The table below summarizes the differences between the two terms.
Budget
Funds
Cannot be spent
Money – real dollars being spent or forecasted to be spent. Funding represents the customer’s ability and commitment to pay.
A number on a piece of paper, in a spreadsheet or database – it is a project management metric
Actual costs recorded in the accounting system of record used for financial reporting
Budgeted Cost for Work Scheduled (BCWS)
Time phased budget for required resources to accomplish tasks scheduled in the integrated master schedule (IMS)
Forms the performance measurement baseline(PMB)
Estimate to Complete (ETC)
Funding required to complete the remaining work, exclusive of prime contractor fee
ETC plus ACWP results in the Estimate at Completion (EAC)
Budgeted Cost for Work Performed (BCWP)
The budget value for completed work
Actual Cost of Work Performed (ACWP)
The costs incurred and recorded to accomplish the work performed
Budget at Completion (BAC)
Budget representing all authorized scope of work (SOW)
Cannot change without a change to the SOW with appropriate approval
Estimate at Completion (EAC)
Funding number representing all the money (at the cost level – does not include fee) that will be spent
Can change without a commensurate change in the SOW
An Overview of Budget Terms
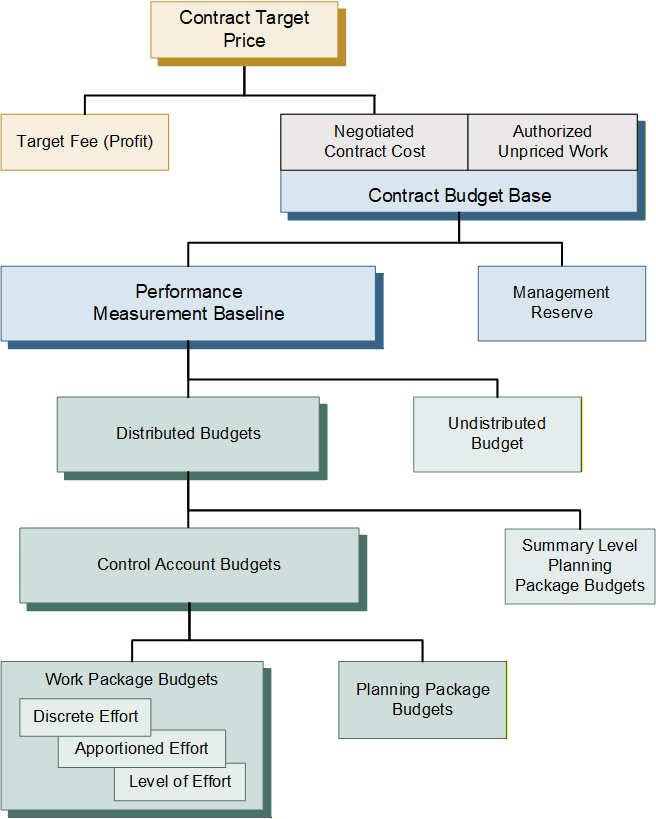
It is often helpful to review the basis for determining and distributing a project’s total budget used for planning and measuring project performance, as illustrated in Figure 1. Note: this is a simplified discussion to highlight the budget terms and does not include nuances such as an Over Target Baseline (OTB) situation.
Figure 1: Budget Distribution and Terms Illustrated
The budgeting process begins with the Contract Target Price (CTP). This is the total negotiated contract value. It includes the negotiated contract cost (NCC) plus the contractor’s planned (target) profit or fee. The Contract Budget Base (CBB) is the starting point for a contractor’s internal budgeting process outlined below.
Budget Component
Definition
Contract Budget Base (CBB)
Represents the financial authorization of the contract and is based on the negotiated contract cost (i.e., price less fee). The CBB is always equal to the negotiated cost for definitized work and the estimated cost for all authorized unpriced work (AUW), also known as Undefinitized Contact Action (UCA). The CBB equals the sum of distributed budgets, undistributed budget, and management reserve (MR). It also equals the sum of the performance measurement baseline (PMB) and MR.
Management Reserve (MR)
Amount of contract budget set aside to handle realized risks and emerging in-scope effort. This effort is in scope to the contract, but out of the scope of distributed and undistributed budget.
Performance Measurement Baseline (PMB)
The PMB is the sum of all distributed direct and indirect budgets against which contract performance is measured. The PMB is the sum of the distributed budgets and undistributed budget. The PMB plus MR is equal to the CBB.
Undistributed Budget (UB)
Budget for authorized work scope that has not yet been identified to a specific WBS element and/or responsible organization at or below the lowest level of reporting to the customer.
Distributed Budgets
Distributed budgets may be comprised of summary level planning package (SLPP) and control account budgets.
Summary Level Planning Package (SLPP) Budgets
Budget may be set aside in SLPPs at the lowest WBS element until the future work effort can be defined in more detail. SLPPs have a high-level scope of work and are scheduled in the IMS with time-phased budgets. They are converted to one or more control accounts with subordinate work packages and planning packages as soon as possible.
Control Account Budgets
Control accounts have a defined scope of work, scheduled start and finish dates, and time-phased budget that reflects the work decomposed to the work package or planning package level. The sum of the time-phased work package and planning package budgets equals the total control account budget.
Work Package/Planning Package Budgets
Work packages and planning packages have a defined scope of work, scheduled start and finish date, and time-phased budget based on the parent control account. This lowest level of budget includes the element of cost detail (labor, material, subcontract, and other direct costs) and value detail (hours, units/quantities, direct costs, and indirect costs).
Notes about Management Reserve
Remember that MR is a budget, is not a financial reserve (i.e., a source of funds). It is not time-phased and is not included in the PMB because there is no related work scope, although it is a part of the CBB. MR budget cannot be used to eliminate cost variances, cover cost overruns, or recover underruns. There is only one MR set aside for a project and the value is never negative.
MR is decreased to provide budget for realized risks or unplanned activities within the contract scope of work. It may be increased whenever the work scope is decreased along with the allocated budget (a contract modification). Customer authorized contract changes, including AUW, should be incorporated into the CBB and PMB as soon as possible; this may include MR budget set aside for added work scope. Only contract changes authorized by the customer’s designated contracting officer may change the CBB value.
Additional note. The MR budget belongs to the contractor’s program manager, not the government customer. MR is not a cost reserve (contingency) for the government customer and may neither be eliminated from contract prices by the customer during subsequent negotiations nor used to absorb the cost of contract changes. For the government customer, contingency is the cost reserve they own, typically associated with a Program Risk-Adjusted Budget (PRB). It is held outside of the project scope, schedule, and budget already provided to the contractor. Reserves held above the program permit senior government management to balance resources within portfolios and among programs. The government customer’s cost reserve could be used to modify the contract to include additional work scope (increases the contractor’s CBB) or provide the funds needed to cover a contract cost overrun.
Budget, Estimates, and Funding Profiles
Contract funding also influences how the PMB budget is allocated and time-phased. The budget distributions are a result of the project planning process (scope of work definition, detailed schedule development, initial cost estimates), MR set aside (risk and opportunity planning), and the funding profile. This is an iterative process to develop the baseline schedule and time-phased budget plan. The budget distributed to the control accounts and any SLPPs is compared to the total PMB/UB value. As needed, adjustments to activities, sequence of work, or resource assignments are made to ensure the overall budget plan reflects the budget limit for the PMB and the contract’s funding profile. For a real-world example of this, see this blog, Understanding the ALAP Scheduling Option in Practical Terms, where a front-loaded schedule was exceeding the funding cap, and how a H&A scheduling consultant helped resolve the issue.
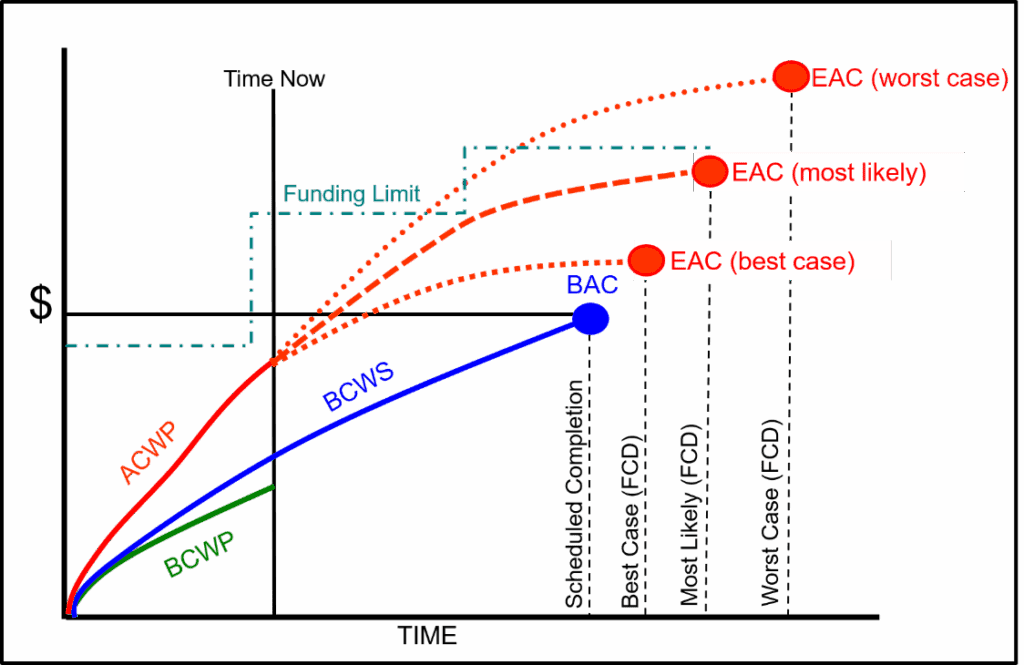
Preparing an EAC every reporting cycle provides an accurate projection of cost at contract completion for internal and external management. It also represents the estimate of total funds required for the contract. The most likely EAC should be within the funding constraints for the contract. Any amounts expended in excess of the contract funding limit puts the contractor at risk. The contractor must notify the customer when their EAC analysis determines there is a potential to breach a funding constraint to address any contract funding issues as quickly as possible.
Figure 2 illustrates a funding profile along with the range of project EACs. In this figure, the most likely EAC is within the contract funding limit.
Figure 2: Management Level EACs with Funding Profile
Reinforcing a Commitment to EVMS Excellence
A common theme of the H&A blogs and articles is helping clients to achieve and maintain a commitment to a high level of excellence in all EVMS process areas. An important part of this is continuous EVM training and project scheduling training, whether for beginners or advanced practitioners. This includes targeted training when clients identify an area where project personnel could use a refresher, more hands-on training, or mentoring. Examples include basic and advanced EVMS workshops, Completing Variance Analysis Reports, Developing an ETC and EAC, as well as short, targeted courses on topics such as Budget versus Funds. Give us a call today at (714) 685-1730 to get started.
The NDIA Integrated Program Management Division (IPMD) Planning and Scheduling Excellence Guide (PASEG) includes a list of the acceleration techniques that can be applied to reduce project schedule duration. That section of the guide provides the background for project team discussions on accelerating complex integrated master schedules (IMS) in government contracting environments. This blog is intended to increase awareness of the techniques in the guide and provide some additional insight into their application. It relies heavily on the guide’s content.
An additional purpose of this blog is to promote the use of the NDIA IPMD nomenclature across the defense industry spectrum. In much the same way as the earned value management (EVM) acronyms of BCWS, BCWP, ACWP and others have become standard terminology, it would be beneficial to have a more standard way of discussing schedule acceleration techniques. As the PASEG is an industry guide developed and maintained in collaboration with U.S Government agencies, the PASEG promotes a common understanding of these techniques.
One caution. Modifications like the ones discussed here can introduce additional risk into the schedule and reduces flexibility. Be careful when modifying the schedule. A good practice is to first create a copy of the schedule and assess the effects of your changes before you adopt them. The trade-offs may or may not be acceptable depending upon the objective you want to achieve. If the schedule is the priority, there is likely to be an impact on the work scope or cost. There can also be unintended consequences when potential impacts are overlooked.
Let’s review the techniques from the PASEG.
Crashing.
The guide says “This technique allows for the acceleration of schedule by applying additional resources or more experienced resources to do the work in a shorter period of time. This method assumes that the task can be completed in a shorter amount of time with the increase in resources.”
We probably have all used this method when we are shopping on the internet and we are faced with the choice between receiving the item in 5 days or accelerating that to 3 days or even the next day. We are paying more to get it faster. But what is really happening behind the scenes? Do they pick your order first? Do they pack it first? Do they ship it on faster carrier? Those are the actions you would be considering on your project when you want to accelerate something by crashing the schedule.
Using outside or contract labor is a form of this where we boost our workforce for a period when we need extra effort. A form of this is offloading some work to a subcontractor.
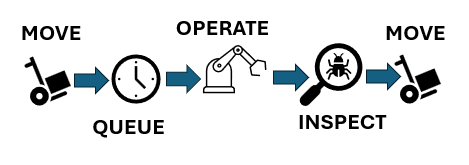
A more detailed example comes from the factory setting where certain orders are “expedited”. What that might mean is that the normal movement process is subverted. The normal process might be as shown in Figure 1 with a queue time while your order waits for the machine. The machine will be torn down and set up for your work when it is most efficient to do so.
Figure 1: Process with wait time
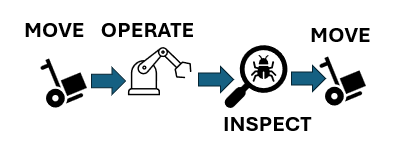
When you crash this process, you might simply remove the queue time so that as soon as your order arrives the machine is torn down and set up for your job to eliminate the wait time as shown in Figure 2.
Figure 2: Process with wait time eliminated
However, using this approach is likely to increase cost and has the potential to introduce other risks to the project. A real-world example comes from the semiconductor industry where the factory was running both standard products and custom products. A normal custom order time of 8 weeks was cut to 2 weeks by using this approach. The cost that was charged to the customer for the rushed custom order was about 10 times the normal cost of an order to repay the factory for lost efficiency.
Fast-tracking.
The guide tells us “This technique accelerates the plan by performing work in parallel. With this method, extra attention needs to be put on resource de-confliction to ensure resources are not over allocated.”
We have all used this technique and probably had mixed outcomes. It seems simple and attractive. It embodies a “just get it done” mentality. If there are sufficient trained and capable resources then this can work. The resources can be used on both efforts at the same time. If that is not the case, then basically we would have to revert to pushing effort out of the way for another effort. This type of modification can introduce additional risk that may need to be mitigated.
Streamlining.
The guide defines this technique in this way: “This technique depends on the team’s ability to find an alternate and more efficient completion methodology for the task/s. This includes reuse, innovation, and possibly eliminating non-value-added work. With this method, the program has to weigh the level of potential risk involved with these choices. Make sure that this does not drive a “run to fail” mode on the program. Ensure that tasks are meeting the full requirements and scope.”
Here we really need to be careful. In some cases, we might be working with specifications or requirements that demand a certain approach and cannot be changed or waived. Then we need to ask the question, “If there is a better way, why didn’t we assume that in the first place?”
In some cases, we might find this approach fits in with opportunity management. Maybe there is new software or a new machine available that can speed things up and still get things done correctly. We have all been in that situation; just remember the last time you went through a Windows upgrade. Did that go smoothly for you?
In the area of software in particular, we must be aware of the entire ecosystem of tools we use and consider that any new tool applied in a hurry can result in problems. Case in point: one large contractor shifted from 2D drawings to 3D models to speed up and improve the processes, however not all the key suppliers were able to receive and use 3D models. The supply chain broke. Mom and Pop at the M&P Shop could not understand the new work orders.
Focused Work.
The guide describes focused work like this: “This technique employs the program management team to help in reducing multitasking and to remove barriers for the personnel on the program that are working critical and near critical program tasks. This method requires the program culture to adapt and “protect the critical/driving path” and to support the people that are working those efforts. This also requires the program manager to perform daily barrier resolution.”
A discussion on multi-tasking might be fun here, but we will assume for this blog that multi-tasking pulls resources away from tasks to do other selected tasks and that is not always the best approach. The big question here is what happens to the other efforts on the project when we focus on certain tasks. This technique can work well but only if we are aware of the impact to the other work and manage that work as well. Risk can be increased by adopting this approach so be alert. If we really are just removing barriers then we can benefit from this method. If we are just pushing aside other efforts to concentrate on this one, we need to know that and handle all the work properly.
Calendar Adjustment.
The guide tells us, “This technique accelerates the plan by changing the amount of working hours available each day or working days available each week. This method is possible only if the resources and task location support working the increased work periods. Attention needs to be put on resource de-confliction to ensure resources are not over allocated.”
This is possibly the most attractive technique. Who has never had to resort to overtime to get something done? It is common to work extra hours, even over some weekends to get back on schedule. To a schedule practitioner, the calendar adjustment wording refers to the calendar in the scheduling tool and how it can be changed to add time in a day or convert non-working days to working days.
This approach is not free. Overtime costs more than regular time and added shifts bring added costs. You should be aware you need to make a trade-off to determine whether the cost can be justified.
Delay or Descope.
The guide advises, “If other techniques are not a viable option and the resultant schedule delay impact is unacceptable, an option exists to propose delaying or removing the selected scope.”
Notice the use of the word “propose.” Working on a contract may not afford the opportunity to eliminate work or consciously delay work. Coordination with the customer is required. Depending upon the customer’s immediate needs, they may be willing to take a more flexible approach to which work scope items can be delivered in a given time frame when they need to deploy something quickly.
The PASEG goes on to tells us about things to promote and things to avoid. Those discussions are informative and useful. You are encouraged to obtain a copy of the PASEG and learn more on your own. More than that, you are encouraged to use this terminology and spread the use of it so that adoption spreads.
Interested in learning more? The H&A Three Day Project Scheduling Workshop includes content on schedule acceleration techniques as well as managing schedule risk. This is a standard public workshop. Many of our clients schedule an in-house workshop that is specific to the scheduling tools they use such as Microsoft Project or Oracle Primavera P6. Call us today to get started.
EVM consulting helps in effectively managing projects where some work elements are using Agile product development processes by providing expertise in Earned Value Management and how to implement an EVMS that accommodates Agile. Since Agile is a product development methodology and EVM is project management discipline, it is possible to implement both approaches on the same project provided care is taken to document their alignment and linkages. EVM consulting assists with defining the specific areas where Agile and EVM processes and data integrate, increasing the likelihood of project success.
How EVM Consulting Helps Manage Projects Using Agile
EVM consulting helps to effectively manage projects that are using Agile product development processes by providing expert guidance on implementing Earned Value Management practices that accommodate Agile. It allows project managers to track project performance, identify potential issues, and make informed decisions to ensure the project stays on track. EVM consulting also helps in establishing a realistic Performance Measurement Baseline (PMB), improving project forecasting, and enhancing communication among project stakeholders.
Key Components of EVM Consulting
EVM consulting involves implementing a structured and integrated approach to organize, accomplish, and manage all project work effort. The processes include integrating project scope, schedule, and cost objectives, establishing a baseline plan to accomplish project objectives, and using earned value techniques for performance measurement throughout the project execution phase. The main components include:
Performance Measurement Baseline (PMB): Establishing the PMB is a culmination of the integrated planning, scheduling, and budgeting processes and provides a common basis to measure work accomplished as well as to track scope, schedule, and budget changes.
Variance Analysis: Identifying and addressing deviations from the plan helps to ensure technical, schedule, and cost objectives are met by implementing timely corrective actions.
Forecasting: Predicting future project performance based on current trends.
Risk Management: Assessing and mitigating potential threats to project success.
Implementing EVM Consulting for Projects Using Agile
EVM consulting can be an effective way to manage projects that are using Agile product development processes. It helps in tracking project performance and ensuring that it stays within budget and on schedule. With EVM consulting, you can gain valuable insights into the project’s progress and identify any areas needing improvement early on. For those interested in enhancing their EVM proficiency, the EVMS DOD Virtual Learning Lab offers an intensive online EVM training course. This can lead to better decision-making and more efficient project management, ultimately contributing to the project’s success.
Best Practices for EVM Consulting for Projects Using Agile
Incorporating EVM consulting for projects using Agile helps in effective project management. Some best practices include:
Integration: Producing a project directive or procedure that defines how the Agile processes will be integrated with the EVM processes to ensure alignment and data traceability for scope management, scheduling, budgeting, and forecasting as well as to track project progress and performance efficiently. This integration allows for greater visibility and control over the project’s financial and schedule performance, aiding in proactive decision-making and risk management.
Adaptation: Incorporating content into your EVM System Description that discusses the touch points between the Agile and EVM processes to support the iterative and incremental nature of Agile product development, allowing for more accurate measurement of progress and forecasting of project outcomes.
Transparency: Ensure clear communication between the project control team and Agile product development teams to foster collaboration and decision-making. Transparency strengthens trust and enables everyone to make informed contributions towards project success.
Continuous Improvement: Regularly review and adapt EVM practices to enhance project control and product delivery. By embracing continuous improvement, project control teams can refine their EVM processes to better align with evolving project needs and industry best practices.
Conclusion: Maximizing Project Management Effectiveness with EVM Consulting
EVM consulting plays a vital role in maximizing project management effectiveness, especially for projects using Agile product development processes. By leveraging EVM techniques, project managers can gain valuable insights into project performance, identify potential risks, and make informed decisions to drive project success. With EVM consulting, project teams can maintain a strong focus on project objectives, assess progress against predefined criteria, and adapt their approaches as needed. This approach enables more effective resource allocation, risk mitigation, and ultimately, project success.
FAQs: Frequently Asked Questions About EVM Training Courses
Are EVM courses suitable for those who have no knowledge of EVM? Yes, the EVM courses offered by Humphreys & Associates are suitable for both beginners and professionals who want to improve their skills. They offer a range of course options, including online self-paced and live virtual instructor-led courses, to accommodate different schedules and learning styles.
What is the method of delivery for the training? Humphreys & Associates offers online self-paced and live virtual instructor-led courses. The online training is a complete presentation of Humphreys & Associates’ highly regarded three-day EVMS training workshop in an online, interactive, multimedia format.
What documentation is available that can help me understand EVMS and Agile and how they are related? To understand the relationship between EVMS and Agile, the DoD Acquisition Data and Analysis (ADA) Integrated Program Management (IPM) Division has produced resources such as the “Agile and EVM: A Program Manager’s Desk Guide.” This guide explains how Agile methodologies can be integrated with existing DoD program management and system engineering processes, including EVM: NDIA IPMD Industry Practice Guide for Agile on Earned Value Management Programs.
Does the fact that Agile/Scrum Sprints have very short durations cause a problem with EVMS? Agile/Scrum Sprints with very short durations do not cause a problem with EVMS. Teams update their progress daily, and it is preferable if the Sprints are four weeks or less and align with the cut-off dates for the EVMS.
What roles within the Project Management Office (PMO) are there for EVMS and for Agile and how do they relate?The roles within the Project Management Office (PMO) for EVMS and for Agile are varied. For instance, the Scrum Master is a facilitator on the Scrum team and there is no corresponding EVMS role. The team members organize themselves so there is no team lead like the control account manager (CAM) in an EVMS, however, someone on the team will need to function as the CAM for required EVMS actions.
Should the EVM System Description be a single document or a summary document with supporting procedures? There are pros and cons to each approach. The benefit of a single document is that it provides an integrated view of the entire EVMS process without having to reference multiple documents.
How can I ensure that my EVMS complies with the EIA-748 guideline requirements?Humphreys & Associates recommends conducting a requirements analysis or gap analysis to assess what you are currently doing against the EIA-748 32 guidelines taking into account your desired end state and current or impending contractual requirements. The assessment identifies strengths and weaknesses and provides specific recommendations to implement a compliant EVMS.
How can I prepare for an EVMS compliance review? Humphreys & Associates recommends conducting mock EVMS reviews. These reviews provide an independent, fact-based assessment of your EVMS, its implementation, data quality, and proficiency level of EVMS project personnel.
What is the importance of continuous training in maintaining quality schedule and cost data in EVMS? Continuous training is important to ensure project personnel are using the schedule and cost tools effectively, are following the EVMS processes and procedures, and understand what is required to produce and maintain quality data. Humphreys & Associates recommends a proactive stance, with robust change control processes, continuous enhancement of documented practices, and improvements to data management systems to ensure accuracy and traceability.
How can I ensure data integrity in my EVMS? Ensuring data integrity in your EVMS involves making sure that the schedule and cost software tools are properly configured, data validation checks are routinely performed, and that schedule and cost data align. Humphreys & Associates recommends a proactive stance, with robust change control processes, continuous enhancement of documented practices, and improvements to data management systems to ensure accuracy and traceability.
EVM Training Course List
To enhance your skills in this area, we present a comprehensive list of EVM Training Courses tailored to meet the needs of various stakeholders, from project managers to government contractors. Whether you’re preparing for a customer Integrated Baseline Review, seeking to improve your EVM proficiency, or aiming to pass certification exams, these courses offer valuable insights and practical experience. Delivered in an online format, these courses provide the flexibility to learn at your own pace while ensuring a deep understanding of EVM principles and their application in real-world scenarios.
CAM Discussion: The CAM Discussion serves as an essential component of the preparation process for a customer Integrated Baseline Review (IBR), compliance review, or surveillance review. This simulation offers a practical experience of a CAM documentation review and interview session, illustrating how a proficient CAM conducts an interview with a government customer. Additionally, it provides a useful recap emphasizing key technical points along with suggestions for follow-up action items.
CAM Essentials_DOD: CAM Essentials provides comprehensive training to improve EVM proficiency and understanding of the basics. This online training bundle features the EVMS Virtual Learning Lab (DOD), Scheduling Virtual Learning Lab, and CAM Discussion courses, all available separately.
CAM Essentials_DOE: CAM Essentials offers comprehensive tools for improving EVM skills and understanding the fundamentals. This online training bundle includes the EVMS Virtual Learning Lab (DOE), Scheduling Virtual Learning Lab, and CAM Discussion courses, each available separately.
CAM Essentials_NASA: CAM Essentials provides comprehensive training to improve EVM proficiency and understanding of the basics. The online training bundle includes the EVMS Virtual Learning Lab (NASA), Scheduling Virtual Learning Lab, and CAM Discussion courses, which are also available individually.
CPR/IPMR/CFSR Completion and Reconciliation: The Integrated Program Management Report (IPMR) and Contract Funds Status Report (CFSR) are crucial communication tools between contractors and their customers. This online course provides valuable insights into the proper completion of these reports and their reconciliation.
EVMS Certification and Preparation Quiz: This online course comprises 120 questions in four separate quizzes, covering the nine EVMS process groups, the Contract Performance Report (CPR)/Integrated Program Manager Report (IPMR), earned value data analysis, Integrated Baseline Review (IBR), and compliance reviews. It serves as an excellent study and preparation resource for the AACE International Earned Value Professional (EVP) or the PMI Project Management Professional (PMP) certification exams.
EVMS DOD Virtual Learning Lab: The EVMS Virtual Learning Lab offers a comprehensive 21-hour instruction program. This online training delivers Humphreys & Associates’ acclaimed three-day EVMS workshop in an interactive, multimedia format. The video content includes all workshop coursework, quizzes, and case studies, allowing students to assess their understanding and receive prompt feedback through scored quizzes and exams.
EVMS DOE Virtual Learning Lab: The EVMS Virtual Learning Lab offers a comprehensive 21-hour online training program. This interactive multimedia format is based on Humphreys & Associates’ acclaimed three-day EVMS workshop, delivering all course content, quizzes, and case studies in a video format. Students can assess their understanding through scored quizzes and exams.
The course can be used for project personnel to enhance their EVM proficiency or for someone who wants to learn the basics of earned value management at their own pace.
EVMS NASA Virtual Learning Lab: An intensive 21-hour online training program that offers a complete presentation of Humphreys & Associates’ three-day EVMS workshop. The course has been adapted into an interactive multimedia format, including all quizzes and case studies from the original workshop. Students can test their knowledge and receive immediate feedback through scored quizzes and exams.
The course can be used for project personnel to enhance their EVM proficiency or for someone who wants to learn the basics of earned value management at their own pace.
IBR – Online Video: The Integrated Baseline Review (IBR) course is designed to provide a comprehensive understanding of the IBR process. It is a fast-paced presentation that is essential for ensuring a clear grasp of the technical requirements of a project and establishing accurate schedule and cost goals. This course offers a detailed explanation of the review process and can be tailored to provide training for specific needs and timings. The approximate duration of the course is 2 hours.
OTB/OTS Implementation – Online Video: Learn about Over Target Baseline (OTB) and Over Target Schedule (OTS) Implementations in this approximately 1 hour and 30-minute video.
A formal re-programming action, known as an OTB and/or an OTS, may occur during risky major acquisitions. Understanding the rationale for and the various methods used to implement an OTB/OTS, as well as correctly completing the IPMR/CPR formats in accordance with the Data Item Description (DID) instructions, is not a simple process. Our video provides clarity on this complex process.
The video includes completed IPMR/CPR Formats 1, 2, and 3, showcasing four OTB methods, along with before and after Baseline graphs for each method. It also contains examples and Baseline graphs for Over Target Schedule, Format 3.
Scheduling Virtual Learning Lab: The Scheduling Virtual Learning Lab offers an intensive 21 hours of instruction covering critical path fundamentals, schedule baseline, float, network logic development, risk assessment, changes, and scheduling in an EVMS environment. The content is based on the well-regarded three-day Project Scheduling Workshop by Humphreys & Associates, adapted to a video format and featuring quizzes and case studies for immediate knowledge testing and feedback.
The course is designed for project personnel looking to enhance their project scheduling skills and for individuals who want to learn the fundamentals of project scheduling at their own pace.
A student who completes the Scheduling course will earn 21 Professional Development Units (PDUs) or 2.1 Continuing Education Units (CEUs).
For information on Corporate or Quantity Discount pricing, please contact us at products@humphreys-assoc.com or call us at (714) 685-1730.
In June 2022, the Department of Energy (DOE) Office of Project Management (PM) released a new version of its Compliance Assessment Governance (CAG) Version 2.0, formally known as the Compliance Assessment Guidance. The change in name however so slight, reflects the significance the DOE PM places on the EVMS governance process where good governance provides a well-defined structure to continuously sustain and improve the practice of integrated project management. DOE PM believes that during the life cycle of a project EVMS governance is everyone’s responsibility, both customer and contractor alike. While this point has always been the position of DOE PM, its importance towards influencing project outcomes was further highlighted in the results of a recent research study conducted by Arizona State University (ASU) that was sponsored by DOE PM. DOE PM considers the release of CAG 2.0 a significant overhaul to the prior guidance and now aligns with the methodology and structure resulting from the ASU Study.
The primary goal of the ASU Study was to design and produce an evaluation methodology and toolset that can be used across agencies and departments to consistently assess the maturity and environment of projects or programs of various types and sizes that use an EVMS. The toolset developed assesses a spectrum of EVMS maturity attributes centered around the EIA-748 Standard for EVMS Guidelines, while also referencing the Project Management Institute (PMI) American National Standards Institute (ANSI) standard for EVM (2019), and the International Organization for Standardization (ISO) 21508:2018 guidance. It also takes a novel approach by assessing the environment within which an EVMS is employed. This methodology and toolset are known as the Integrated Project/Program (IP2M) Maturity and Environment Total Risk Rating (METRR) (pronounced “IP2M Meter”). By using IP2M METRR to assess both the maturity and environment of an EVMS or less sophisticated management control systems where EIA-748 compliance is not required, project/program leaders and practitioners can understand the efficacy of the EVMS (or similar management control system) in support of integrated project/program management.
Environmental Factors
The new methodology has two primary components. The first component assesses the environmental factors that influence the implementation of an EVMS. The ASU Study identified four primary environmental categories: Culture, People, Practices, and Resources. Each category is further broken down into 27 Environmental Factors (EFs) that are defined by Effectiveness Criteria.
An example of the hierarchy for an EVMS Environmental Assessment is:
Category 1 – Culture
Environmental Factor: 1A – The contractor organization supports and is committed to EVMS implementation, including making the necessary investments for regular maintenance and self-governance.
Factor Check Point: 1A(a) – a) The contractor integrated project team (IPT)—including corporate leadership, execution, and operations personnel, oversight personnel, and support staff—is in place, and it has a demonstrated belief in the intrinsic value of the EVMS to position the project for success.
Each of the 27 EFs is assessed using a 5-point grading scale (i.e., 1. Not Acceptable, 2. Needs Improvement, 3. Meets Some, 4. Meets Most, 5. High Performing) with each having predetermined weightings. When summarized, all EF scores add up to 1,000 possible points. Final weightings were determined through a rigorous statistical analysis of inputs from various professional sources including the survey of professionals experienced with the practice of project management and EVMS implementation. The results of the ASU Study show that the higher the environment score, the better the chances a project or program will achieve better schedule and budget outcomes.
Below are the summary level weightings of the four EVMS Environmental Categories:
Culture: Total Possible Points @ L5 is 313 (31%)
People: Total Possible Points @ L5 is 238 (24%)
Practices: Total Possible Points @ L5 is 235 (24%)
Resources: Total Possible Points @ L5 is 214 (21%)
EVMS Maturity
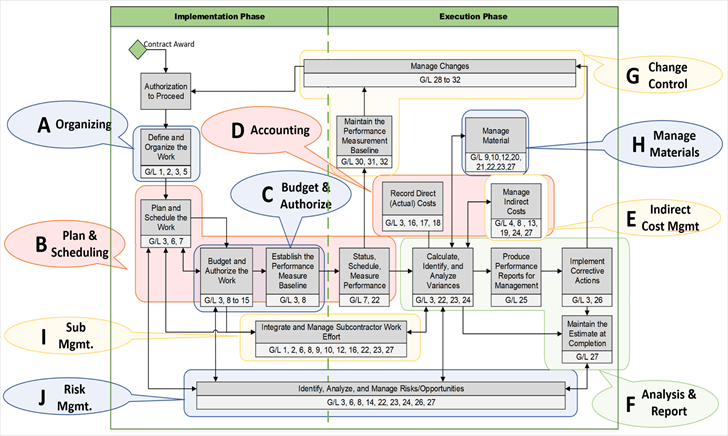
The second component of the ASU Study and Compliance Assessment Governance (CAG, 2.0) addresses EVMS Maturity. The purpose of EVMS Maturity is to assist in the assessment of compliance with the guidelines in the EIA-748. The maturity assessment consists of ten subprocesses, each of which is further divided into 56 attributes. The ten subprocesses may look familiar to practitioners with EVMS experience with the notable addition of “Risk Management” to the traditional nine guideline process groupings. The ASU Study captured the ten subprocess groups with the associated EIA-748 guidelines by using the following graphic from National Defense Industry Association (NDIA) Integrated Program Management Division (IPMD) Earned Value Management Scalability Guide. The primary purpose for doing this was to place greater focus on management subprocesses which are recognized by most practicing project/program managers rather than placing the entire focus on a particular guideline(s).
Figure 1: Ten Subprocess Groups and Associated EIA-748 Guidelines Source: DOE PM CAG 2.0
EVMS Maturity Subprocesses
As shown in Figure 2, each of the ten subprocesses is further broken down into attributes. Each attribute is assessed for a maturity level on a 5-point grading scale, plus the option of “Not Applicable” for those attributes that are not relevant to the project/program. For example, some project/program teams do not use resource-loaded schedules while others do. The 5-point grading scale is as follows: 1-Not Yet Started, 2-Major Gaps, 3-Minor Gaps, 4-No Gaps, 5-Best in Class. Attributes that are mature enough to be deemed an EIA-748 compliant EVMS are at a maturity level of “4.” The IP2M METRR methodology allows for a grade of “5” acknowledging management practices that optimize the EVMS. There are two primary sources to make this assessment. The first is the Effectiveness Criteria established for each maturity level, and the second is the DOE Attribute Metrics defined in 188 EVMS Testing Specification Sheets.
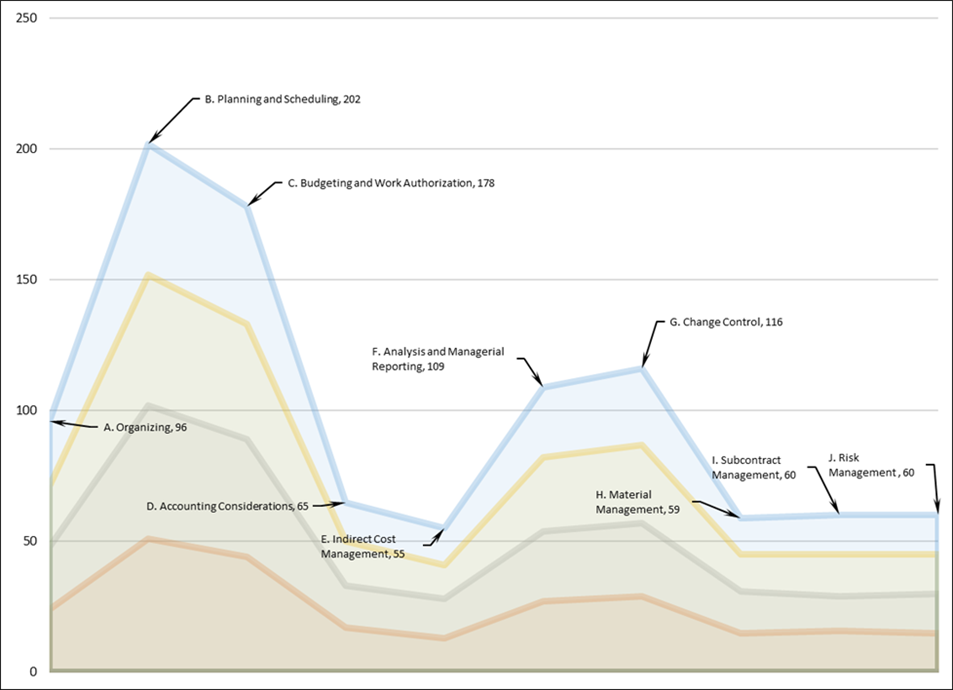
Below are the summary level weightings of the ten EVMS Maturity Subprocesses:
Organizing: Total Possible Points @ L5 is 96 (10%)
Planning and Scheduling: Total Possible Points @ L5 is 202 (20%)
Budgeting and Work Authorization: Total Possible Points @ L5 is 178 (18%)
Accounting Considerations: Total Possible Points @ L5 is 65 (7%)
Indirect Budget and Cost Management: Total Possible Points @ L5 is 55 (6%)
Analysis and Management Reporting: Total Possible Points @ L5 is 109 (11%)
Change Control: Total Possible Points @ L5 is 116 (12%)
Material Management: Total Possible Points @ L5 is 59 (6%)
Subcontract Management: Total Possible Points @ L5 is 60 (6%)
Risk Management: Total Possible Points @ L5 is 60 (6%)
Figure 2: Ten Subprocess Groups Broken Down into Attributes Source: DOE PM CAG 2.0
Of the ten subprocesses that constitute the EVMS, subprocesses B and C account for 380 points or 38% of the maximum score of 1,000 points (Figure 2). When combined with subprocesses F and G, these four subprocesses account for 605 points, or 61%, of the maximum score. Thus, emphasizing credible plans, schedules, and budgets with adequate controls and rigorous reporting best positions the EVMS to help the project/program team achieve their objectives.
An example of the evaluation hierarchy for an EVMS Maturity Assessment is:
Sub-Process A: Organizing
Attribute A.1: A single product-oriented Work Breakdown Structure (WBS) encompasses all authorized work and is decomposed to the appropriate levels for effective management and reporting.
Effectiveness Criteria A.1.1: The process to establish a singular, product-oriented WBS that accurately defines the products, services, and deliverables required to complete the project/program has been developed, documented, and approved.
Metric ID A.01.05: This metric confirms that the WBS includes all authorized project work and any revisions resulting from authorized changes and modifications. This metric ensures that the WBS identifiers collectively provide a complete definition of work scope requirements.
DOE PM’s goal for the new guidance is to provide a synthesized and uniform approach to assessing an EVMS as a means to ensure fairness and consistency in its operations. The current version of the DOE EVMS Implementation Guidance and IP2M METRR documentation can be found here: