EVM Analysis

Determining Responsibility for Indirect Cost Variance Analysis – Part 2

, ,

How are the Indirect Cost Rates Used on Projects?

The debate that has continued since the inception of the earned value concepts in the 1960s has been: “Who should report on and analyze the cost variances attributable to indirect costs?”

This blog is the second in the series of blogs to help answer this question.  The first blog covered a few fundamentals about how indirect cost rates are established to set the stage.  This blog discusses how indirect rates are applied and how project personnel display indirect costs for internal or performance reporting.  Part 3 concludes the discussion on the indirect cost variance analysis process.  It covers what the EIA-748 Standard for Earned Value Management Systems (EVMS) and related government agency guides have to say on the subject as well as discussing the best option for determining who is responsible for indirect cost variance analysis.  

There are a number of variables at the project or detail work element level related to indirect costs we often encounter when working with our clients.  These variables can influence the level of visibility into how the indirect costs are impacting the project’s total cost.  For example:

  • Accounting may only provide a summary or “wrap” set of direct or indirect rates to the project offices to apply to the project’s base budget or estimate to complete (ETC) values.  The rate details may be unknown to project personnel since they are provided a “composite” rate for planning a performance measurement baseline (PMB), actual cost accumulation, and later for estimating ETCs.
  • The control account level work authorizations may or may not include indirect costs.  The control account managers (CAMs) may or may not have visibility into the total cost for the work effort they are responsible for.  
  • The level of detail the customer is requesting the contractor to display the indirect costs for performance reporting.  

Applying the Indirect Rates at the Detail Level

The current approved direct and indirect rates are applied at the lowest level where the CAMs are planning their work resource requirements.  This is usually at the work package level where the CAMs plan their time phased budget labor hours, material quantities or direct cost, subcontract, or other direct costs (ODCs) that match when the work package activity is scheduled to occur.  This helps the CAMs to determine what direct and indirect cost factors make up their total cost for their control account.  

Example Control Account Analysis of Time Phased Direct and Indirect Costs

An example output a CAM could use to analyze their budget time phased element of cost details is illustrated in Figure 1 (produced from ProjStream MaxTeam ).  Assuming the CAM has indirect costs in their control accounts, a similar approach is used for their time phased ETC.  

Figure 1: Example Control Account Analysis of Time Phased Direct and Indirect Costs

Why is this level of detail useful to the CAMs and project managers?  When they are planning to process a baseline change request (BCR) for future work budget, or if they modify their ETC, they can quickly see the impact of changing an element of cost.  Examples include switching from make to buy or buy to make, increasing or decreasing hours, changing the duration of an activity, or swapping out labor resources (a different skill mix) on the associated indirect costs.  

How Direct and Indirect Costs are Displayed for Use on a Project

While it may seem obvious, it is worthwhile to point out that project personnel:  

  1. Do not control how indirect costs are applied.  The corporate Cost Accounting Standards Board (CASB) Disclosure Statement or similar accounting procedure controls this.  Finance or accounting provides the current set of approved direct and indirect rates the project offices are directed to use.  
  2. Do control their base direct costs (labor hours, material quantities or direct cost, subcontract, or ODCs).  The approved direct labor rates and indirect rates are applied to these base direct cost values.  
  3. Do control how the indirect costs are displayed for internal use or performance reports. 

Project direct and indirect cost information can be summarized and displayed at various levels of detail that project personnel can use as needed.  The purpose of the following simplified “dollarized” responsibility assignment matrices (RAMs) is to illustrate different ways internal budget data could be displayed to provide some level of visibility into the project’s indirect costs. 

Indirect Costs Displayed at WBS and Organizational Structure Elements

In Figure 2, the total indirect cost amounts are shown at the WBS reporting elements (1.1.1, 1.1.2, etc.), and also by the organizational elements (Org A1, Org A2, etc.).  This provides a project manager visibility into the indirect budgets at these levels.  What this RAM does not provide visibility into is the different types of indirect costs that make up the total amounts planned.  This could include the various categories of the indirect costs so a project manager could compare the amount of labor indirect, material indirect, general and administrative (G&A) indirect, and cost of money (COM) that are contributing to the total amounts planned.  When that level of visibility is desired, Figure 3 illustrates an alternate approach.  
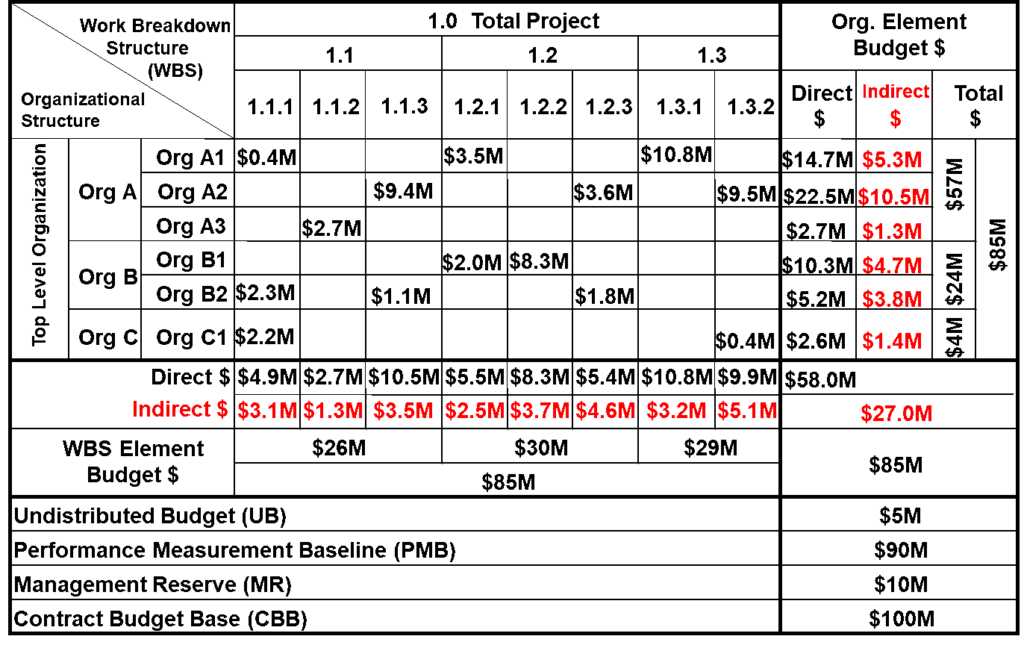
Figure 2: Indirect Costs Displayed at WBS and Organizational Structure Elements

Indirect Costs Displayed at the Total Project Level

Figure 3 does not separate out the indirect costs by WBS elements or organizational elements.  Instead, it displays the total amounts for each indirect cost pool (summary lines for other overheads, G&A, and COM).  The amounts shown at the control account level are only the direct cost budgets assigned to the CAMs in their work authorization documents, which total $58.0M (shown in the lower right corner).  Based on how this data is displayed, the expectation would be the CAMs are managing just their direct cost budgets.  This approach (total project level) does not provide visibility into the indirect costs at the various WBS or organizational structure element levels.  
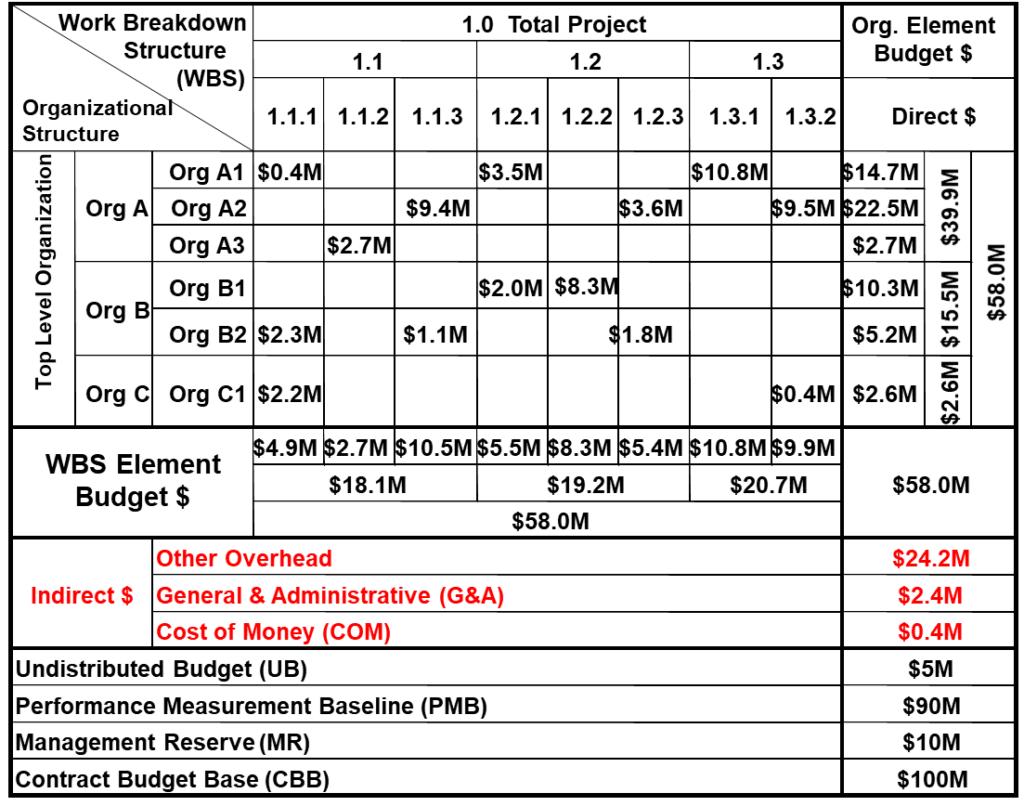
Figure 3: Indirect Costs Displayed at the Total Project Level

Fully Burdened RAM

In Figure 4, the entire $85M budget assigned to the CAMs is fully burdened (includes direct and indirect costs).  This would be reflected in their work authorization documents.  Based on how the data are displayed, the expectation would be the CAMs are managing, analyzing, and reporting on not only the direct costs, but also on the indirect costs for their scope of work.  This method, however, gives no visibility into how much of each control account is direct cost versus indirect cost in the RAM.  It would be necessary to drill down into the detail work package and resource assignment source data to determine the breakout of direct and indirect costs (see Figure 1).  

Figure 4: Fully Burdened RAM

Fully Burdened RAM with Indirect Cost Summaries for WBS and Organizational Elements

What if the project manager takes a different approach to provide some visibility into the indirect costs?  In Figure 5, the body of the RAM reflects the fully burdened (direct and indirect budgets) similar to Figure 4.  Additionally, it also provides the total indirect cost summary for each major WBS element and organizational element, in what are called “Non-Add” entries.  
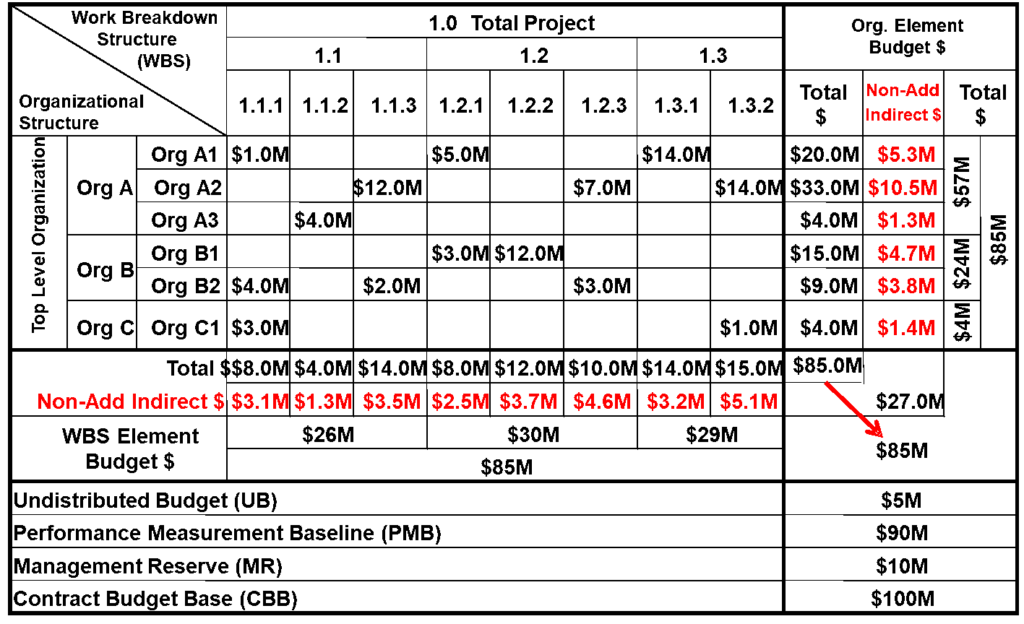
Figure 5: Fully Burdened RAM with Indirect Cost Summaries for WBS and Organizational Elements

Indirect Cost Details in Project Performance Reports

How the project indirect cost information is summarized and displayed also applies to the formal contract performance reports.  Customers often tailor the reporting requirements by specifying how they expect indirect costs to be separated out on the Integrated Program Management Report (IPMR) Formats 1, 2, and 7 or provided in the Integrated Program Management Data and Analysis Report (IPMDAR) Contract Performance Dataset (CPD) for visibility into the project’s direct and indirect costs.  

Example Partial IPMR Format 1 

For illustration purposes, a partial example IPMR Format 1 is shown in Figure 6.  This example illustrates the typical “default” detail in the body of the report (Block 8. Performance Data, a. Work Breakdown Structure Element).  The columns include the direct costs plus other overheads (anything other than COM or G&A) for the WBS element rows.  Rows 8. b. and 8. c. separate out the COM and G&A indirect costs at the project level. 
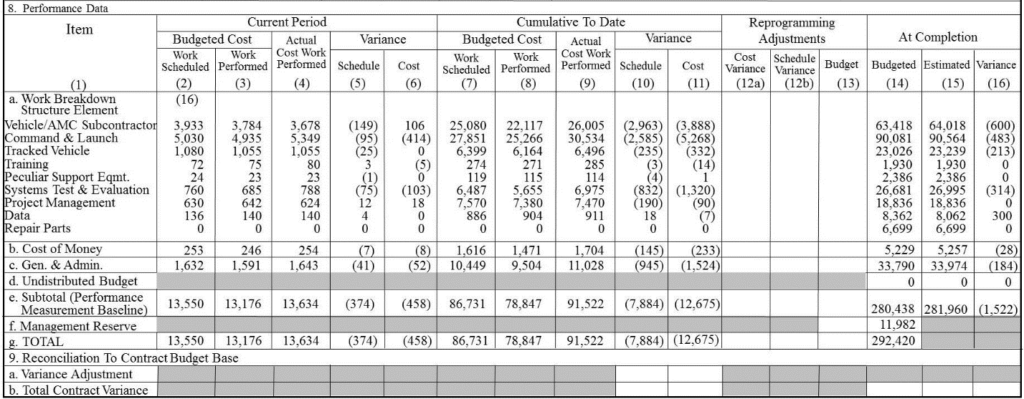
Figure 6: Example Partial IPMR Format 1
Figure 6: Example Partial IPMR Format 1 

This default layout provides limited visibility into the indirect costs of the project.  Should the customer want more visibility into the contribution of the indirect costs on the project, tailoring options we often see specified in a contract include:

  1. The body of the report displays the direct costs for the WBS elements and a summary line is added to provide visibility into indirect costs other than the COM and G&A, which are displayed at the total project level.  
  2. Similar to option 1, the body of the report displays the direct costs for the WBS elements.  Instead of one summary line for the other indirect costs, there is a summary line for each indirect pool, as defined in the contractor’s CASB Disclosure Statement.  For example, an Engineering indirect cost row, Manufacturing indirect cost row, Material indirect cost row, and Service indirect cost row. 
  3. For each WBS element in the body of report, there are additional rows that break out the direct cost and the indirect cost categories.  Sometimes the direct costs are also broken down into the major element of cost categories such as labor, material, subcontract, and ODC.  

When the customer requires additional indirect cost detail in the formal performance reports, note that the applicable narrative report (IPMR Format 5 or the IPMDAR Performance Narrative Report) will need to include a discussion on significant cost variances for those indirect cost categories when applicable.  This is discussed further in the next blog.  

Part 3 of this series of blogs will discuss the cost and schedule variance analysis process and how to determine who should be responsible for indirect cost variance analysis.  


Other Posts from this Series

Determining Responsibility for Indirect Cost Variance Analysis – Part 2 Read Post »

Management Reserve; Comparing Earned Value Management (EVM) and Financial Management Views of “Reserves”

, , , , , , , , , ,
Management Reserve & Earned Value ManagementPerhaps you have witnessed the collision of earned value management’s views on “management reserve” with the Chief Financial Officer (CFO) and the finance department’s views on “balance sheet reserves.” Most companies tend to organize EVM, the function, reporting to either the programs’ organization or to the finance organization. Either will work but either can fail if the two organizations do not understand the interest of the other.

In this article we will outline three areas. The first will be EVM and Management Reserve (MR). The second will be finance and balance sheet “contingencies, loss provisions, or reserves.” The third will compare the two views and identify where they are similar and where they differ.

We will use two terms for both EVM and Financial Management; “in play” and “on the sideline.” “In play” for EVM means that it is in your Performance Measurement Baseline (PMB) and Budget at Completion (BAC). “On the sideline” for EVM means “not in scope” therefore in MR. “In play” for financial management means recorded on the balance sheet (e.g.: current liability; an accrued liability). “On the sideline” for financial management means not recorded on the balance sheet, because it is more likely than not that a liability has been incurred.   If material, however, it will likely be disclosed in the notes to the financial statements, even if it is not recorded on the balance sheet.


Earned Value Management and Management Reserve

A program manager and his or her team must deal with – mitigate – risk or be consumed by those risks as they become issues. There are two types of risks, known and unknown. The known risks are entered into a risk register, and their likelihood and consequence are determined. Mitigation for those known risks is done at the activity level in a program’s Integrated Master Schedule (IMS) (Planning and Scheduling Excellence Guide — PASEG page 141, ¶ 10.3.1). Mitigation of known risks is part of the PMB (in the BAC) and is therefore “in play.”

The second type of risk – unknown or unknowable risks – are covered by management reserve if within the Scope of Work (SOW) of the existing contract. If contractor and customer conclude that the realized risk is outside the existing contract, then an Engineering Change Proposal (ECP) would likely be created by the contractor; and a contract modification would be issued by the authorized customer contracting officer if they agreed.   The program manager should ask this question of his team: what work is “at risk” and what work is not “at risk?” Does labor or material present more risk? Management reserve “is an amount of the overall contract budget held for management control purposes and for unplanned events” (Integrated Program Management Report–IPMR DI-MGMT-81861 page 9, ¶ 3.2.4.6). Management reserve is “on the sidelines.” MR has no scope. MR is not earmarked. MR stands in waiting.


Earned Value Management Reserve (MR) Compared To Financial Management “Contingency”

Because the audience reading this blog is most likely from the EVM community, I’ll offer a Financial Management example of a company that faces many risks and must manage those risks or be consumed by them. Altria Group, Inc. and Subsidiaries (stock symbol: MO) are in the tobacco, e-Vapor and wine business. Altria’s history clearly shows that the company measures and successfully mitigates the risks they face. Altria faces a blizzard of litigation each year and must protect its shareholders from that risk. So how does Altria manage known risks (mostly from litigation) and how does Altria handle unknown risks?

Altria is a publicly traded company and its annual report (10K) is available on-line to the public. This data is from their 2014 annual report.

I am an MBA, not a CPA, so I’ll stick to Altria’s 2014 balance sheet. For those not familiar with financial statements, a balance sheet has on its left hand side all of a company’s assets – what the company owns and uses in its business (current assets = cash, accounts receivable, inventory; long term assets = property, plant and equipment). The right hand side of a company’s balance sheet shows current and non-current liabilities and shareholders’ equity. The top right hand side of the balance sheet includes current and non-current liabilities (accounts payable, customer advances, current and long-term debt, and accrued liabilities like income taxes, accrued payroll and employee benefits, accrued pension benefits and accrued litigation settlement costs) and the bottom of the right hand side of the balance sheet includes shareholders’ equity consisting of common and preferred stock, paid in capital and retained earnings.

Altria’s 2014 annual report shows under current liabilities; accrued liabilities; settlement charges (for pending litigation Contingency note # 18) a value of $3.5 billion dollars. The 2013 amount was $3.391 billion dollars.

So Altria has “in play” $3.5B for litigation for 2014. In financial terms, Altria has recorded $3.5 billion in expense related to the litigation, probably over several years as it became more likely than not that a liability had been incurred and was reasonably estimable. In EVM terms Altria has $3.5B in their baseline, or earmarked, or in scope for litigation (court cases).

What happens if Altria ultimately has more than $3.5B in litigation settlement costs? What does Altria have waiting on the “sidelines” to cover the unknown risks? Essentially Altria has on its balance sheet waiting “on the sidelines” $3.321 billion in cash and the ability to borrow additional funds or perhaps to sell additional shares of stock to fund the settlement costs. In EVM terms Altria has $3.5B in its baseline (on its balance sheet) to manage the risks associated with litigation. Altria’s market capitalization at the market close on May 17, 2015 was $52.82 billion and its 2014 net revenues were $24.522 billion. It is reasonable to understand that Altria has more than enough MR.


Differences Between EVM MR and Financial Management Balance Sheet Reserves

In EVM, MR is only released to cover unplanned or unknown events that are in scope to the contract but out-of-scope to any control account. A cost under-run is never reversed to MR, and a cost over-run is never erased with the release of MR into scope.

In industry in general, and Altria in particular, if the “in play” current liability for settlement charges of $3.5B are not needed (an under-run), then Altria will reverse a portion of the existing accrued liability into income, thereby improving profitability. If Altria’s balance sheet reserve of $3.5B is insufficient, then Altria’s future profits will be reduced as an additional provision will be expensed to increase the existing reserve (an over-run).

[Humphreys & Associates wishes to thank Robert “Too Tall” Kenney for authoring this article.]

Management Reserve; Comparing Earned Value Management (EVM) and Financial Management Views of “Reserves” Read Post »

EVMS Variance Analysis — EVMS Analysis and Management Reports

, , , ,

A Variance Analysis Report (VAR) that includes specific information about the cause, impact, and corrective action “provides management with early insight into the extent of problems and allows corrective actions to be implemented in time to affect the future course of the program” [reference: NDIA, IPMD EIA-748 (Revision D) EVMS Intent Guide]. Unfortunately, variance analysis is an easy target for criticism during EVMS reviews. There are many examples of inadequate variance analysis to choose from, but what they all have in common is the lack of specific information on the “why, what, how, when, and who” of any variance. The variance analysis reporting requirements are found in the EIA-748 (Revision D) Guidelines in Section IV., Analysis and Management Reports, Guidelines 22-27.

EIA-748 Guidelines
Section IV. Analysis and Management Reports
22 2-4a Control Account Monthly Summary, Identification of CV and SV
23* 2-4b Explain Significant Variances | Earned Value Management
24 2-4c Identify and Explain Indirect Cost Variances
25 2-4d Summarize Data Elements and Variances thru WBS/OBS for Management
26* 2-4e Implement Management Actions as Result of EVM Analysis
27* 2-4f Revise EAC Based on Performance Data; Calculate VAC


A VAR that includes specific information and data about a problem will allow management to make informed decisions and mitigate project risk. Getting specific about variance analysis reporting includes the following elements.

Overall:

  • Emphasis on the quantitative, not qualitative
  • Emphasis on the specific, not the general
  • Emphasis on significant problems, not all problems
  • Define abbreviations and acronyms at first use
  • The Control Account Manager (CAM) is the most knowledgeable person to write the variance analysis report but will need information from the business support team

Cause:

  • Isolate significant variances
  • Discuss cost and schedule variances separately
  • Clearly identify the reason (root cause) for the variance (ties to the corrective action plan)
  • Clear, concise explanation of the technical reason for the variance
  • Provide cost element analysis
    • Labor – hours, direct rates, skill mix, overtime (rate & volume)
    • Material – unplanned requirements, excess quantities, unfavorable prices (price & usage)
    • Subcontracts – changing requirements, additional in-scope work, schedule changes
    • Other Direct Costs – unanticipated usage, in-house vendor
    • Overhead (indirect) – direct base, rate changes
  • Identify what tasks are behind schedule and why

Impact:

  • Describe specific cost, schedule, and technical impact on the project
  • Project future control account performance (continuing problem)
  • Address effect on immediate tasks, intermediate schedules, critical path, driving paths, risk mitigation tasks
  • Describe erosion of schedule margin, impacts to contractual milestones or delivery dates, and when the schedule variance will become zero (this may only mean the work getting completed late (BCWPcum =BCWScum); and does not necessarily mean getting “back on schedule”
  • Describe any impact to other control accounts
  • Assess the need to revise and provide rationale for the Estimate at Completion (justify ETC realism – CPI to TCPI comparison, impacts of corrective action plan, risk mitigation, open commitments, staffing changes, etc.)
  • Note: If there is a root cause, there will be an impact. It could be related to cost, schedule, lessons learned to be applied to future activity, an update required to a process to support the corrective action or a re-prioritization of resources to meet a schedule.

Corrective Action Planning:

  • Describe specific actions being taken, or to be taken, to alleviate or minimize the impact of the problem
  • Include the individual or organization responsible for the required action
  • Include schedules for the actions and estimated completion dates (ECD)
  • If no corrective action is possible, explain why
  • Include results of corrective action plans in previous VARs.

Ask yourself, is the analyses presented in a manner that is understandable? Does the data support the narrative? Does the variance explanation provide specifics of:

why” the problem occurred,
what” is impacted now or in the future,
how” the corrective action is being taken,
when” the corrective actions will occur,
when” the schedule variance will become zero, and/ or the work gets “back on schedule”
who” is responsible for implementing the corrections?

Remember, a well-developed Variance Analysis Report can reduce the risk of a Corrective Action Request (CAR) during an EVMS review.

EVMS Variance Analysis — EVMS Analysis and Management Reports Read Post »

Is it OTB/OTS Time or Just Address the Variances?

,

EVM: OTB/OTS Time or Just Address the VariancesNo project manager and project team ever wants to go through an Over Target Baseline (OTB) or Over Target Schedule (OTS).  The idea of formally reprogramming the remaining work and adjusting variances at the lowest level can be daunting and extremely time consuming. As painful as an OTB/OTS is, a project manager must first determine if the reprogramming is necessary.  Several factors should be considered before an OTB/OTS is declared and implemented.

NOTE: This paper addresses a Formal reprogramming as including both an OTB and an OTS.  If the Contract Performance Report is the CDRL Requirement, an OTS is not a part of a Formal Reprogramming.  It is a separate action.

Performance Data

Projected successful execution of the remaining effort is the leading indicator of whether an OTB/OTS is needed. Significant projected cost overruns or the inability to meet scheduled milestones play a major role in determining the need for an OTB/OTS as these indicators can provide a clear determination that the baseline is no longer achievable.

Leading indicators also include significant differences between the Estimate to Complete (ETC) and the Budgeted Cost of Work Remaining (BCWR). This is also demonstrated by major differences between the Cost Performance Index (CPI) and the To Complete Performance Index (TCPI).  These differences are evidence that the projected cost performance required to meet the Estimate at Completion is not achievable, and may also indicate that the estimated completion costs do not include all risk considerations. Excessive use of Management Reserve (MR) early in the project could also be an indicator.

 Schedule indicators include increased concurrency amongst remaining tasks, high amounts of negative float, and significant slips in the critical path, questionable activity durations and inadequate schedule margin for remaining work scope.  Any of these conditions may indicate that an OTB/OTS is necessary.

Quantified Factors

Various significant indicators in both cost and schedule can provide a clear picture that an OTB/OTS is warranted.  The term “significant” can be seen as extremely subjective and vary from project to project. For further evidence, other more quantified indicators can be used to supplement what has already been discussed.

Industry guidelines (such as the Over Target Baseline and Over Target Schedule Guide by the Performance Assessments and Root Cause Analyses (PARCA) Office) suggest the contract should be more than 20% complete before considering an OTB/OTS.  However, the same guidance also recommends against an OTB/OTS if the forecasted remaining duration is less than 18 months. Other indicators include comparing the Estimate to Complete with the remaining work to determine projected growth by using the following equation:

Projected Future Cost Overrun (%) = ([(EACPMB-ACWP) / (BACPMB-BCWP) – 1)] X 100

If the Projected Future Cost Overrun percentage were greater than 15%, then an OTB/OTS might be considered. Certainly the dollar magnitude must be considered as well.

Conclusion

There is no exact way to determine if an OTB/OTS is needed, and the project personnel must adequately assess all factors to make the determination. Going through an OTB/OTS is very time consuming, and the decision regarding that implementation should not be taken lightly.

After all factors are adequately analyzed, the project manager may ultimately deem it unnecessary and just manage to the variances being reported. This may be more cost effective and practical than initiating a formal reprogramming action.

If you have any questions about this article contact Humphrey’s & Associates. Comments welcome.

We offer a workshop on this topic: EVMS and Project Management Training Over Target Baseline (OTB) and Over Target Schedule (OTS) Implementation.

Is it OTB/OTS Time or Just Address the Variances? Read Post »

7 Principles of Earned Value Management Tier 2 System Implementation | EVM Analysis

, , ,

Updated: Watch our review video of 7 Principles of Earned Value Management Tier 2 System Implementation Intent Guide


7 Principles of Earned Value Management Intent GuideThe Assistant Secretary for Preparedness and Response (ASPR) issued the “7 Principles of Earned Value Management Tier 2 System Implementation Intent Guide,” 21 December 2011.  Since most of BARDA acquisitions are unique in that they are not Information Technology (IT) projects or Construction projects, they developed a tiered approach to applying EVMS. Tier 1 are construction and IT contracts and will require full ANSI/EIA-748 compliance. Tier 2 contracts are defined as countermeasure research and development contracts that have a total acquisition cost greater than $25 million and have a Technical Readiness Level of less than 7. Tier 2 contracts will apply EVM principles that comply with the 7 Principles of EVM Implementation. Tier 3 are countermeasure research and development contracts between $10 million and $25 million and will require EVM implementation that is consistent with the 7 Principles approach. The focus of this implementation guide is on the Tier 2 contracts.

The Intent Guide contains explanations for each Principle, a Glossary of Terms, a Supplemental EVM Implementation Guideline, and Sample EVM Documents. The Supplemental EVM Implementation Guideline contains recommendations regarding EVM process flows, tools, the necessity to integrate the EVM engine with the accounting system, basic documentation requirements, ranges of implementation costs, recommendations on requirements for support personnel, and use of the 7 Principles on Tier 3 programs.

The Intent Guide defines Tier 2 as: “For countermeasure research and development contracts that have total acquisition costs greater than or equal to $25 million and have a Technical Readiness Level (TRL) of less than 7 will apply EVM principles for tracking cost, schedule and technical performance that comply with the 7 Principles of EVM Implementation.”

The 7 Principles of Earned Value Management

1. Plan all work scope to completion.

This Principle includes development of a Work Breakdown Structure (WBS) and WBS Dictionary that includes all of the work scope.  It is also recommended that detailed scope definition be accomplished at the work package level.

2. Break down the program work scope into finite pieces that can be assigned to a responsible person or organization for control of technical, schedule and cost objectives.

This Principle defines the schedule requirements.  Most scheduling functions are required including network scheduling, horizontal and vertical traceability, forecasting schedule start and complete dates, and critical path analysis.  The contract milestones must also be included in the schedule.

This Principle also discusses the organizational requirements.  The Control Account Manager must be identified but there is no requirement for the costs to roll up through organizational elements; this, and development of an Organization Breakdown Structure (OBS) is recommended if it can be done in a cost effective manner.

3. Integrate program work scope, schedule, and cost objectives into a performance measurement baseline plan against which accomplishments can be measured. Control changes to the baseline.

This Principle is discussed in the Intent Guide in two parts.  The first, 3a, regards integration of scope, schedule, and cost objectives into a performance measurement baseline. The schedule can be either resource loaded or the budgets loaded into a cost tool and a time-phased control account plan generated.  The cost tool must be linked to the schedule tool to ensure baseline integration.  The planning includes both direct and indirect dollars.

This Principle also defines the use of undistributed budget and management reserve.

The second part of this Principle, 3b, is the requirement to control changes to the baseline. This requires that contractual changes be incorporated to the baseline in a timely manner.

Budget logs are to be used to track both external and internal changes. All changes are to have documentation that explains the rational/justification for the change and the scope, schedule and budget for that change.

4. Use actual costs incurred and recorded in accomplishing the work performed.

This Principle requires that actual costs be accumulated in a formal accounting system consistent with the way the work was planned and budgeted.  A work order or job order coding system must be used to identify costs to the control account and allow summarization through higher levels of the Work Breakdown Structure.  The use of estimated actuals is also required for material and subcontractors to ensure that earned value data is not skewed.

5. Objectively assess accomplishments at the work performance level.

This Principle requires that schedule status and earned value assessment must occur at least monthly.  The allowable earned value techniques are discussed as well as the requirements of for the use of each.

6. Analyze significant variances from the plan, forecast impacts, and prepare an estimate at completion based on performance to date and work to be performed.

This principle is also divided into two parts.  The first, 6a, regards the analysis of variances from the plan.  The earned value system must be able to calculate cost and schedule variances, at least cumulatively, on a monthly basis.  The system should also be able to provide the Cost Performance Index (CPI), the Schedule Performance Index (SPI), and the use of the To-Complete Performance Index (TCPI) is also encouraged.  Variances that exceed the contract variance thresholds must be explained in terms of the cause, impact and corrective action.  Although this Principle does not discuss the preparation of a Variance Analysis Report (<abbr=”Variance Analysis Report”>VAR) by the CAM, Principle 7 does require that Program Managers hold their CAMs accountable to write a proper Variance Analysis Report (Earned Value Management Analysis).

The second part of this Principle, 6b, requires that an Estimate at Completion (EAC) be prepared based on performance to date and the work remaining to be performed.

7. Use earned value information in the company’s management processes.

This Principle regards Program Management use of the earned value data to manage the program’s technical, schedule and cost issues and how that data is used in the decision making process.

Although much of the language in the Intent Guide is similar to that of typical guidance documents for the EVMS requirements, it must be remembered that the EVMS Guidelines are not being implemented, only the 7 Principles.  The Principles define an approach to managing programs with the basic requirements of Earned Value; such that the cost of the system is minimized, but only those elements necessary to manage these types of programs are necessary.  This allows for further system flexibility and reduces the documentation needed.  For instance, in Principle 1, the requirements of the WBS Dictionary could be expanded to contain the information that would normally be included on the Work Authorization Document.  If this were done, Work Authorization Documents are not necessary because the WAD content normally contained would be embodied in the WBS dictionary; and the associated cost is reduced over the life of the program.

With the 7 Principles there is no need for an EVM compliance review.  An Integrated Baseline Review (IBR), also known as a Performance Measurement Baseline Review (PMBR), could be required.

The 7 Principles Comparison to the EIA-748 32 Guidelines

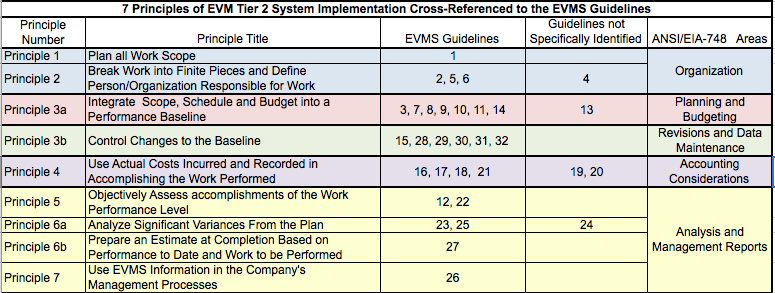
For those who are more accustomed to the EVMS Guidelines as described in the EIA Standard, EIA-748, in the table below the 7 Principles are loosely identified to the 32 Guidelines and Guideline areas.  This does not mean that all of the requirements must be met with the 7 Principles only that they can be cross-referenced.  Several of the Guidelines are not specifically identified but could be considered as incorporated by reference. The indirect cost requirements are incorporated by planning the work with both direct and indirect dollars; therefore, it is implied that budget, earned value, and actual costs would also include both direct and indirect costs.

The appendix also contains the requirement that the EVM Engine needs to be integrated with the company’s accounting system.  Further, some programs may also be required to be compliant with the Cost Accounting Standards.  Guideline 20, “Identify unit costs, equivalent units costs, or lot costs when needed” is not included; this more than likely would not be a requirement for HHS or BARDA programs.

Earned Value Analysis: 7 Principles of EVM Tier 2 System Implementation Cross-Reference to the EVMS Guidelines

7 Principles of EVM Tier 2 System Implementation Cross-Reference to the EVMS Guidelines
Principle Number Principle Title EVMS Guidelines Guidelines not Specifically Indentified ANSI/EIA-748 Areas
Principle 1 Plan all Work Scope 1 Organization
Principle 2 Break Work into Finite Pieces and Define Person/Organization Responsible for Work 2, 5, 6 4
Principle 3a
Integrate Scope, Schedule and Budget into a Performance Baseline 3, 7, 8, 9, 10, 11, 14 13 Planning & Budgeting
Principle 3b
Control Changes to the Baseline 15, 28, 29, 30, 31, 32 Revision & Data Maintenance
Principle 4 Use Actual Costs Incurred and Recorded in Accomplishing the Work Performed 16, 17, 18, 21 19, 20 Accounting Considerations
Principle 5 Objectively Assess Accomplishments of the Work Performance “Level 12, 22 EVM Analysis & Management Reports
Principle 6a
Analyze Significant Variances fomr the Plan 23, 25 24
Principle 6b
Prepare and Estimate at Completion based on Performance to-data and Workd to be Performed 27
Principle 7 Use EVM information in the Company’s Management Processes 26

Recommendations for Enhancement to the Intent Guide

The 7 Principles Intent Guide was issued in December 2011. In June 2012 the requirements for the Integrated Program Management Report (IPMR) was issued; this will replace the Contract Performance Report (CPR) for contracts issued after June 2012. When a revision to the Intent Guide is issued, the IPMR should be included.

The Intent Guide is a “what to do” document and contains little on “how to do it”. Internal procedural documents should be required to define how a company will implement the Guide requirements.

Principle 6a requires that the cost and schedule variances be calculated at least on a cumulative basis and only recommends calculation of the current month. The current month calculation should be a requirement since both the CPR and the IPMR require current month reporting.

Summary

The “7 Principles of Tier 2 System Implementation Intent Guide” requires the basic elements of earned value and the documentation necessary to demonstrate that earned value is being adequately implemented on Tier 2 programs. H&A personnel understand the requirements and are able to “size” those requirements to meet company and customer needs. Click to request a PDF copy of the Intent Guide.

Humphreys & Associates (H&A) has been providing Earned Value Management training and implementation services for over 35 years. H&A provides self-paced online, classroom and private training courses, as well as training tailored to specific industry needs, and can assist in all aspects of Earned Value Management Implementation.

For more information about EVM training or support, or with questions about your company’s requirements, please contact the Humphreys & Associates corporate office.


7 Principles of Earned Value Management Tier 2 System Implementation | EVM Analysis Read Post »

EVM Material Earned Value – Price vs. Usage Variance Analysis – Part 3

, , , ,

EVM (Earned Value Management) control account managers (CAMs) with material cost elements are required to conduct price vs. usage material cost variance analysis as a normal part of their root cause analysis for their control accounts.  This analysis is the material counterpart to conducting a labor rate versus hours (efficiency) cost variance analysis.

Material price/usage analysis looks at the two components of a material cost variance:

  • Price.  How much of the cost variance was caused by the unit price paid for the material item differing from the earned value unit price for the material?
  • Usage.  How much of the cost variance was caused by the earned value for the quantity of the material differing from the actual quantity of the material?

A common question is “How can we do this when we have thousands of material items to account for on a project?”

The answer:  Not all material items have to be tracked discretely to conduct an adequate price/usage analysis, with the general rule of thumb of discretely tracking about 80% of the material dollars.

Some contractors set a policy where material will be tracked discretely if it breaks a specific dollar value (for example, anything above a $5,000 unit price).  Other contractors conduct what is called an “80/20” analysis of their estimated bill of material (BOM).  The concept here is that on most programs, approximately 20% of the material items (larger dollar items) represent about 80% of the material dollars on the program, with the other 80% of the BOM being the smaller dollar items that total about 20% of the material dollars.  In this case, the discretely measured items are any of the items in the top 20% of the BOM.

Some contractors do this segregation by the unit price of each material item.  Others make the division based on the extended price (unit price times the number of units to purchase), sometimes placing a high volume/low price item on the discretely tracked 20% list.  Either method is acceptable.

Even with this discrete material segregation, the price/usage analysis still needs to be performed.  The difference is discrete items are tracked separately (e.g., a $250,000 radar antenna dish) from a commodity grouping (such as all connecting bolts – average planned price of $10 per pound).

The variance analysis method is the same for discretely measured items and for the homogeneous groupings of material items where:

Price Variance = (BCWP Unit Price – ACWP Unit Price) x ACWP Quantity

Usage Variance = (BCWP Quantity – ACWP Quantity) x BCWP Unit Price

Another common question is “Where do I get this sort of information?”

Most material departments or supply chain management teams maintain detailed listings of all materials the company receives as well as what particular projects receive.  While these listings are generally used to identify material deliveries, late deliveries, material availability for transfers or borrow-paybacks, etc., they generally have the unit price and quantity purchased information necessary for the CAMs (or at least the material department) to perform the price/usage analysis required.  It may require special runs, or sorts, of the BOMs or inventories that are maintained, but the information is usually available.

The CAMs can take these runs and conduct their algorithms to do the price/usage calculations described above.  Generally, these systems contain enough information to discretely measure every part number to the lowest unit price item on the project.  Earned value management, however, does not require reporting price and usage analysis on “connecting bolt #123 with a price of $0.0000134 per unit.”

Humphreys & Associates is available for EVM consulting, CAM certification and additional information on this topic. Contact us today.

EVM Material Earned Value – Price vs. Usage Variance Analysis – Part 3 Read Post »

Scroll to Top