A previous blog, Maintaining a Credible Estimate at Completion (EAC), discussed why producing a realistic EAC is essential to managing the remaining work on a contract. Internal management and the customer need visibility into the most likely total cost for the contract at completion to ensure it is within the negotiated contract cost and funding limits.
As noted in the earlier blog, one common technique to test the realism of the EAC is to compare the cumulative to date Cost Performance Index (CPI) to the To Complete Performance Index (TCPI).
Example of Using the Metrics for Evaluating Data
One example of documented guidance to industry for evaluating the realism of the EAC is the DOE Office of Project Management (PM) Compliance Assessment Governance (CAG) 2.0, and the related DOE EVMS Metric Specifications they use to assess the quality of schedule and cost data. This blog highlights the use of this guidance and how any contractor can incorporate similar best practices to verify EACs at a given WBS element, control account, or project level are realistic.
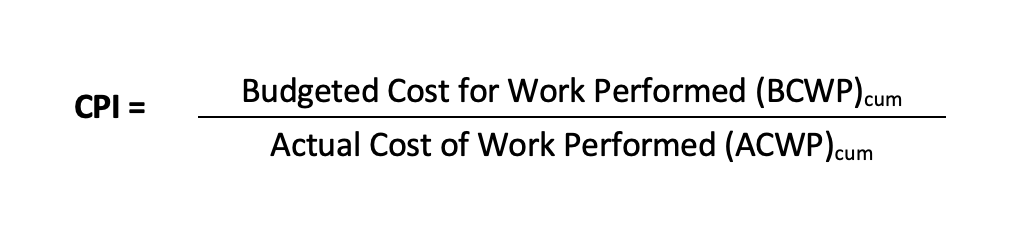
To refresh, the CPI is the efficiency at which work has been performed so far for a WBS element, control account, or at the total project level. The formula for the cumulative to date CPI is as follows.
Best practice tip: To ensure a valid CPI calculation, verify the BCWP and ACWP are recorded in the same month for the same work performed.
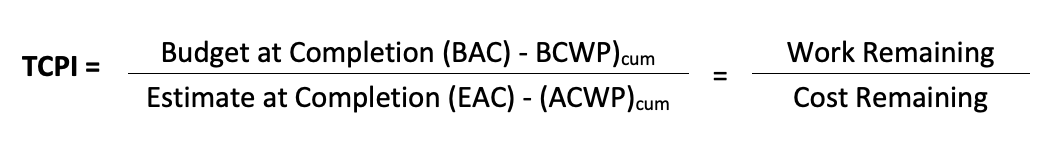
The TCPI provides the same information, however, it is forward looking. While the CPI is the work efficiency so far, the TCPI is the efficiency required to complete the remaining work to achieve the EAC. The formula for the TCPI is as follows.
Best practice tip: To ensure a valid TCPI, verify the BCWP and ACWP are recorded in the same month for the same work performed, and the BAC and EAC are for the same work scope. In other words, the scope of work assumptions are the same for the budget and remaining cost. This is why anticipated changes should not be included in the EAC.
The DOE uses the CPI in two of their assessment metrics and the TCPI in one, however, these are critical metrics partly because they are the only ones used to assess two different data evaluations: 1) commingling level of effort (LOE) and discrete work, and 2) EAC realism.
Commingling LOE and Discrete Work
The first use of CPI (no TCPI in this metric) falls under the Budgeting and Work Authorization subprocess. The primary purpose is to evaluate the effect of commingling LOE and discrete work scope has on control account metrics. The basic premise for this metric is that if the CPI for the LOE scope is significantly different than that for the discrete, the mixture of LOE in that control account is likely skewing overall performance reporting.
Here is the formulation DOE uses.
C.09.01: Control Account CPI delta between Discrete and LOE >= ±0.1
X = Number of incomplete control accounts (WBS elements) in the EVMS cost tool, where
The LOE portion of the budget is between 15% and 80% of the total budget, and
The difference between the CPI for the discrete work and the LOE work is >= ±0.1.
Y = Number of incomplete control accounts (WBS elements) in the EVMS cost tool.
Threshold = 0%
Best practice tip: Run this metric quarterly on your control accounts that commingle LOE and discrete work packages. When there is a significant discrepancy between the performance of the LOE versus discrete work effort, consider isolating the LOE effort from the discrete effort at the earliest opportunity. An example could be the next rolling wave planning window or as part of an internal replanning action. Alternatively, it may be necessary to perform the calculations at the work package level to assess the performance of just the discrete effort when it is impractical to isolate by other means.
Process and procedure tip: Ensure the LOE work packages within a control account are kept to minimum (typically less than 15%), during the baseline development phase. This helps to prevent discrete work effort performance measurement distortion during the execution phase. A useful best practice H&A earned value consultants have helped contractors to implement during the budget baseline development process is to perform an analysis of the earned value methods used within a control account and the associated work package budgets. This helps to verify any LOE work packages are less than the 15% threshold for the control account. In some instances, it may be logical to segregate the LOE work effort into a separate control account. The objective is to identify and resolve the issue before the performance measurement baseline (PMB) is set.
EAC Realism
One DOE metric uses the TCPI and this involves a comparison to the CPI. This falls in the Analysis and Management Reporting subprocess. This DOE EVMS Metric Specification states: “This metric confirms that estimates of costs at completion are accurate and detailed.” As noted above, the metric compares the cost performance efficiency so far to the cost efficiency needed to achieve the EAC and is specific to the EAC a control account manager (CAM) would review for their scope of work. Depending on the level actual costs are collected, this analysis may need to be performed at the work package level instead of the control account level.
Here is the formulation DOE uses assuming actual costs are collected at the work package level.
F.05.06: Work Package CPI – EAC TCPI > ±0.1 X = Number of incomplete (>10% complete) work packages where CPI –TCPI > ±0.1. Y = Number of incomplete (>10% complete) work packages in the EVMS cost tool. Threshold = 5%
There is no requirement that the forecast of future costs has a linear relationship with past performance. While there may be legitimate reasons why future cost performance will fluctuate from the past, outside reviewers who receive EVM data will look for a trend or preponderance of data that would indicate the EACs are not realistic. When a significant number of active work packages are outside the ±0.1 CPI-TCPI threshold, it is an indication that the EACs are not being maintained or are driven by factors other than project performance.
Best practice tip: Run this metric every month for each active work package prior to month-end close. For those work packages outside the ±0.1 threshold, review the EAC to ensure it is an intentional forecast of costs given the current conditions.
Process and procedure tip: One of the training courses H&A earned value consultants often conduct is a Variance Analysis Reporting (VAR) workshop. This workshop is designed to help CAMs become more proficient with using the EVM metrics to assess the performance to date for their work effort, identify the root cause of significant variances, and document their findings as well as recommended corrective actions. This analysis includes verifying their estimate to complete (ETC) is a reasonable assessment of what is required to complete the remaining authorized work and their EACs are credible.
Additional References
Further discussion on using the CPI and TCPI to assess the EAC realism at the project level can be found in the DOE CAG, Analysis and Management reporting subprocess, Estimates at Completion. This section provides a good overview of comparing the cumulative to date CPI to the TCPI as well as comparing an EAC to calculated independent EACs (IEACs) for further analysis to assess the EAC credibility.
Interested in learning more about using EVM metrics as a means to verify EACs at the detail or project level are realistic? H&A earned value consultants can help you incorporate best practices into your processes and procedures as well as conduct targeted training to improve your ETC and EAC process. Call us today at (714) 685-1730.
Project management is a complex and multi-faceted field that requires a great deal of attention to detail. One of the most important aspects of project management is being able to accurately assess the status and health of a project at any given time. This is where visual representations come in.
Visual Aids
One of the most effective ways to evaluate the status of a project is through the use of charts and graphs. These visual aids allow top management to quickly and easily assess whether a project is getting better or worse, and whether the estimated completion costs (EACs) are achievable.
Raising Questions
In the case of the chart shown in the video, the cost line is trending downwards, which is a cause for concern. This raises the question of whether this negative trend can be reversed to meet even the most pessimistic EAC set by the customer’s program manager.
Management and Customers
While the chart shown in the video is from a program that was ultimately canceled, it serves as an important reminder of the crucial role that visual representations play in project management. These types of charts and graphs are commonly used in briefs presented to top management and customers, as they provide a clear and concise snapshot of the project’s status.
More EVMS Training
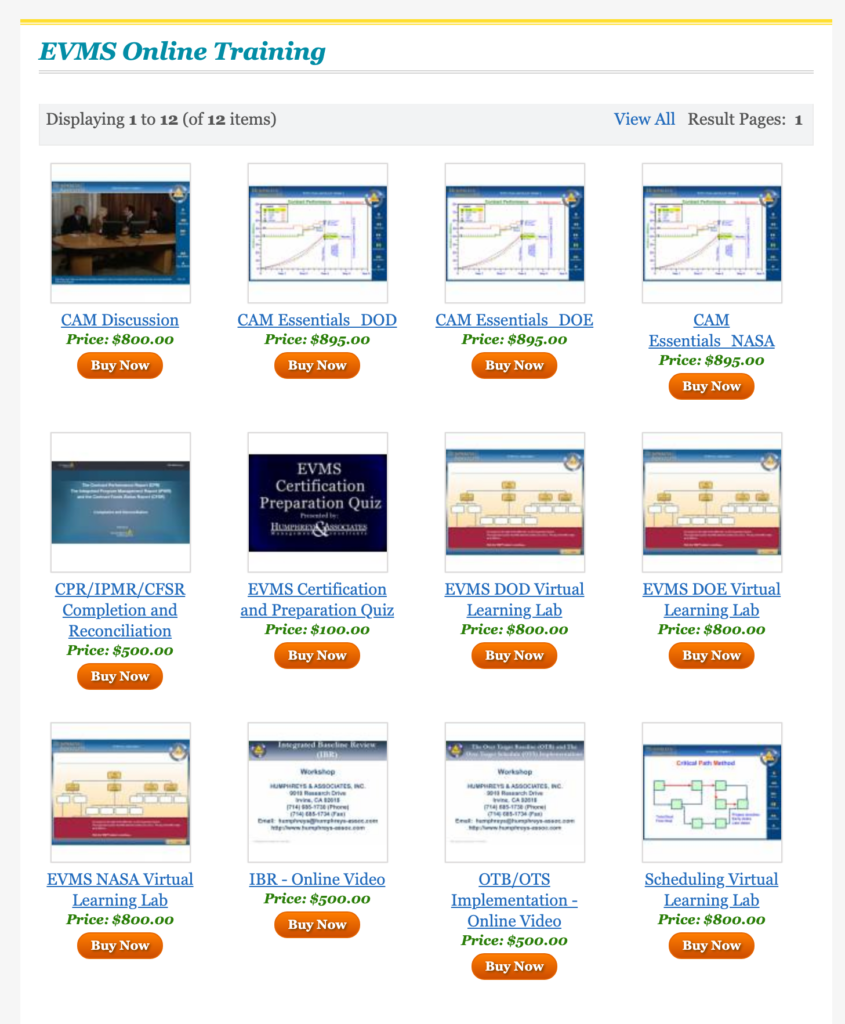
Take your EVMS training to the next level with our online course that is based on Humphreys & Associates’ highly regarded three-day EVMS workshop. We also offer a version of this same EVM training course customized for Department Of Defense (DOD) specific EVM requirements, as well as one designed specifically toward NASA’s EVM requirements!
Not sure what the different requirements are between the DOE and NASA? Can’t remember if Cost and Software Data Reporting (CSDR) is required for an NSA contract? Check out our easy to read Earned Value Management Systems Document Matrix
All Online Courses
EVM (Earned Value Management) is a comprehensive approach to project management that covers all aspects of a project, from start to finish. Humphreys and Associates offers EVM courses that will provide you with the necessary skills and knowledge to manage EVM projects of all sizes effectively.
Our EVM courses are suitable for both beginners and professionals who want to improve their skills. We offer a range of course options, including online self-paced and live virtual instructor-led courses, to accommodate different schedules and learning styles. Our instructors are seasoned EVM professionals who will guide you through the process, from setting up your EVM system to closing out your project.
At Humphreys and Associates, you can trust in the quality of our EVM training. Our online EVM courses are budget-friendly and flexible, allowing you to obtain the education you need without any stress. Plus, our courses are designed to be completed in a short time, so you can quickly gain the knowledge you need.
Enroll in our EVM courses today and start enhancing your project management skills.
EVM training sessions are offered throughout the year by H&A. EVMS, advanced Earned Value Management techniques, and project scheduling are all covered during these frequent public EVM workshops. These earned value education courses are ideal for anybody wanting to increase their understanding of or application of EVMS or scheduling. Our training programs are suited for individuals with various degrees.
Public EVMS Workshops are offered either in person or online. View our Upcoming EVM Workshop Schedule to find one that best suits your schedule and location.
Top management relies on performance measurement data to make informed decisions about whether a project is worth undertaking and how much money should be allocated to it. This is done by examining trends in performance data over time and benchmarking the organization against others. Additionally, top management uses performance measurement data to assess the effectiveness of their own interventions to improve organizational performance.
Project complexity is increasing and costs are soaring. Despite this, top management remains ever vigilant in their pursuit of ensuring that taxpayer money is being well spent on government projects. In this lesson, we will explore how all performance measurement data are used by top management to make informed decisions about government projects. Stay tuned!
More EVMS Training
If you liked this video you can purchase the entire course below. This video is an excerpt from the Department of Defense (DOD) version of this eLearning module. We also offer the same course customized for the Department of Energy’s (DOE) specific Earned Value Management (EVM) implementation/requirements, as well as a version of the course customized for NASA’s EVM implementation/requirements.
Not sure what the different requirements are between the DOE and NASA? Can’t remember if Cost and Software Data Reporting (CSDR) is required for an NSA contract? Check out our easy to read Earned Value Management Systems Document Matrix
All Online Courses
EVMS courses are available online, making it easy for you to get the education and training you need without having to leave your home or office. Plus, our instructors are experienced professionals who will help you learn everything you need to know about EVMS.
We have a wide range of courses available, from introductory level to more advanced subjects. You can find the perfect course for your needs and start learning today.
Our online EVMS courses are affordable and convenient, so you can get the education you need without any hassle. Plus, our courses are designed to help you learn everything you need to know about EVMS in a short amount of time.
Get started today and find the perfect online EVMS course for you.
EVM training sessions are offered throughout the year by H&A. EVMS, advanced earned value management techniques, and project scheduling are all covered during these frequent public EVM workshops. These earned value education courses are ideal for anybody wanting to increase their understanding of or application of EVMS or scheduling. Our training programs are suited for individuals with various degrees.
Public EVMS Workshops are offered either in person or online. View our Upcoming EVM Workshop Schedule to find one that best suits your schedule and location.
The EVMS Guidelines are Grouped in five major categories which address these five sections:
0:12 – Organization 0:32 – Planning, Scheduling, and Budgeting 0:46 – Accounting Considerations 0:56 – Analysis and Management Reports 1:15 – Revisions and Data Maintenance
More EVMS Training
If you liked this video you can purchase the entire course below. This video is an excerpt from the Department of Defense (DOD) version of this eLearning module. We also offer the same course customized for the Department of Energy’s (DOE) specific Earned Value Management (EVM) implementation/requirements, as well as a version of the course customized for NASA’s EVM implementation/requirements.
Not sure what the different requirements are between the DOE and NASA? Can’t remember if Cost and Software Data Reporting (CSDR) is required for an NSA contract? Check out our easy to read Earned Value Management Systems Document Matrix
This chapter looks at how risk is evaluated when developing an Earned Value Management System.
Video Contents
You can use the links below to jump to a specific part of the video. 0:00 – A Closer Look at Risk 0:25 – Risk Drives Other Concerns 0:59 – Types of Risk 1:19 – Risk Opportunities 1:38 – Risk Analysis and Selective Controls 1:54 – Balance Cost with Benefit
More EVMS Training
If you liked this video you can purchase the entire course below. This video is an excerpt from the Department of Defense (DOD) version of this eLearning module. We also offer the same course customized for the Department of Energy’s (DOE) specific Earned Value Management (EVM) implementation/requirements, as well as a version of the course customized for NASA’s EVM implementation/requirements.
Not sure what the different requirements are between the DOE and NASA? Can’t remember if Cost and Software Data Reporting (CSDR) is required for an NSA contract? Check out our easy to read Earned Value Management Systems Document Matrix
The debate that has continued since the inception of the earned value concepts in the 1960s has been: “Who should report on and analyze the cost variances attributable to indirect costs?”
This blog is the second in the series of blogs to help answer this question. The first blogcovered a few fundamentals about how indirect cost rates are established to set the stage. This blog discusses how indirect rates are applied and how project personnel display indirect costs for internal or performance reporting. Part 3 concludes the discussion on the indirect cost variance analysis process. It covers what the EIA-748 Standard for Earned Value Management Systems (EVMS) and related government agency guides have to say on the subject as well as discussing the best option for determining who is responsible for indirect cost variance analysis.
There are a number of variables at the project or detail work element level related to indirect costs we often encounter when working with our clients. These variables can influence the level of visibility into how the indirect costs are impacting the project’s total cost. For example:
Accounting may only provide a summary or “wrap” set of direct or indirect rates to the project offices to apply to the project’s base budget or estimate to complete (ETC) values. The rate details may be unknown to project personnel since they are provided a “composite” rate for planning a performance measurement baseline (PMB), actual cost accumulation, and later for estimating ETCs.
The control account level work authorizations may or may not include indirect costs. The control account managers (CAMs) may or may not have visibility into the total cost for the work effort they are responsible for.
The level of detail the customer is requesting the contractor to display the indirect costs for performance reporting.
Applying the Indirect Rates at the Detail Level
The current approved direct and indirect rates are applied at the lowest level where the CAMs are planning their work resource requirements. This is usually at the work package level where the CAMs plan their time phased budget labor hours, material quantities or direct cost, subcontract, or other direct costs (ODCs) that match when the work package activity is scheduled to occur. This helps the CAMs to determine what direct and indirect cost factors make up their total cost for their control account.
Example Control Account Analysis of Time Phased Direct and Indirect Costs
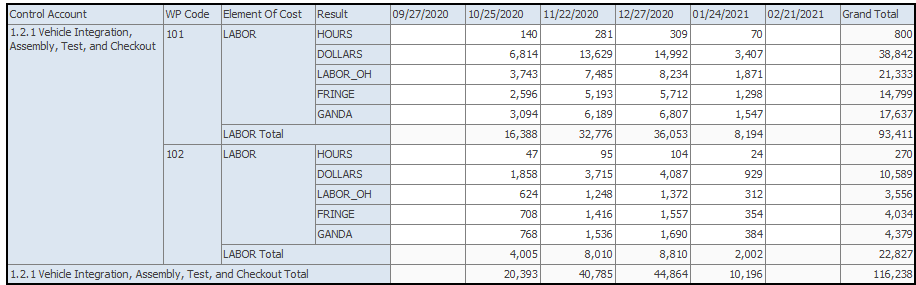
An example output a CAM could use to analyze their budget time phased element of cost details is illustrated in Figure 1 (produced from ProjStream MaxTeam ). Assuming the CAM has indirect costs in their control accounts, a similar approach is used for their time phased ETC.
Figure 1: Example Control Account Analysis of Time Phased Direct and Indirect Costs
Why is this level of detail useful to the CAMs and project managers? When they are planning to process a baseline change request (BCR) for future work budget, or if they modify their ETC, they can quickly see the impact of changing an element of cost. Examples include switching from make to buy or buy to make, increasing or decreasing hours, changing the duration of an activity, or swapping out labor resources (a different skill mix) on the associated indirect costs.
How Direct and Indirect Costs are Displayed for Use on a Project
While it may seem obvious, it is worthwhile to point out that project personnel:
Do not control how indirect costs are applied. The corporate Cost Accounting Standards Board (CASB) Disclosure Statement or similar accounting procedure controls this. Finance or accounting provides the current set of approved direct and indirect rates the project offices are directed to use.
Do control their base direct costs (labor hours, material quantities or direct cost, subcontract, or ODCs). The approved direct labor rates and indirect rates are applied to these base direct cost values.
Do control how the indirect costs are displayed for internal use or performance reports.
Project direct and indirect cost information can be summarized and displayed at various levels of detail that project personnel can use as needed. The purpose of the following simplified “dollarized” responsibility assignment matrices (RAMs) is to illustrate different ways internal budget data could be displayed to provide some level of visibility into the project’s indirect costs.
Indirect Costs Displayed at WBS and Organizational Structure Elements
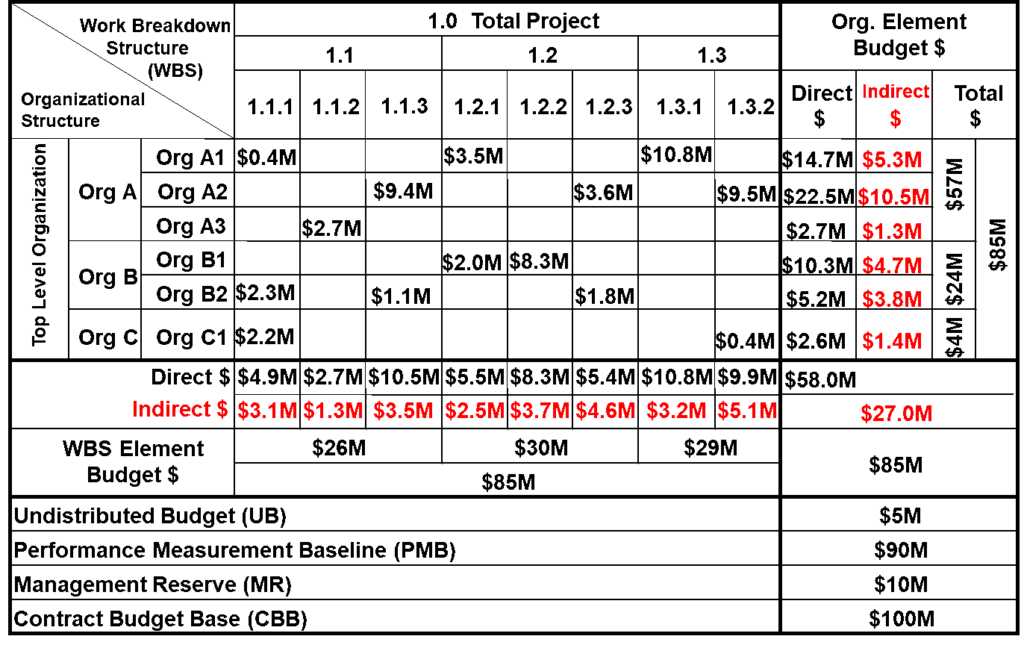
In Figure 2, the total indirect cost amounts are shown at the WBS reporting elements (1.1.1, 1.1.2, etc.), and also by the organizational elements (Org A1, Org A2, etc.). This provides a project manager visibility into the indirect budgets at these levels. What this RAM does not provide visibility into is the different types of indirect costs that make up the total amounts planned. This could include the various categories of the indirect costs so a project manager could compare the amount of labor indirect, material indirect, general and administrative (G&A) indirect, and cost of money (COM) that are contributing to the total amounts planned. When that level of visibility is desired, Figure 3 illustrates an alternate approach.
Figure 2: Indirect Costs Displayed at WBS and Organizational Structure Elements
Indirect Costs Displayed at the Total Project Level
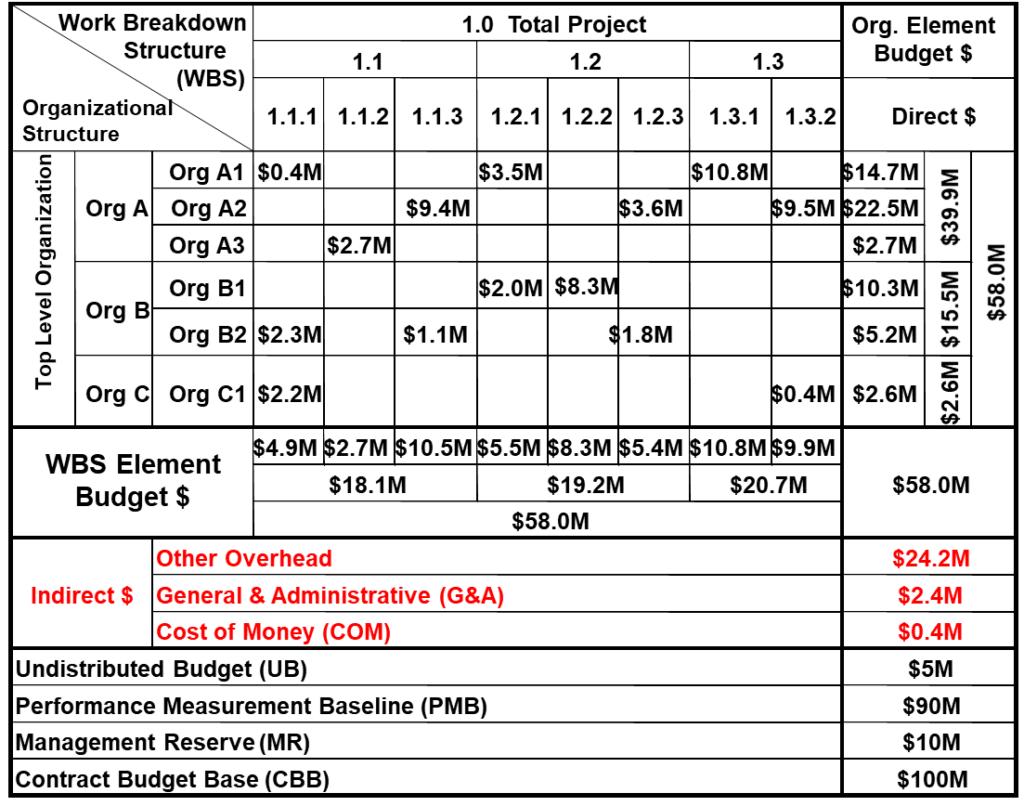
Figure 3 does not separate out the indirect costs by WBS elements or organizational elements. Instead, it displays the total amounts for each indirect cost pool (summary lines for other overheads, G&A, and COM). The amounts shown at the control account level are only the direct cost budgets assigned to the CAMs in their work authorization documents, which total $58.0M (shown in the lower right corner). Based on how this data is displayed, the expectation would be the CAMs are managing just their direct cost budgets. This approach (total project level) does not provide visibility into the indirect costs at the various WBS or organizational structure element levels.
Figure 3: Indirect Costs Displayed at the Total Project Level
Fully Burdened RAM
In Figure 4, the entire $85M budget assigned to the CAMs is fully burdened (includes direct and indirect costs). This would be reflected in their work authorization documents. Based on how the data are displayed, the expectation would be the CAMs are managing, analyzing, and reporting on not only the direct costs, but also on the indirect costs for their scope of work. This method, however, gives no visibility into how much of each control account is direct cost versus indirect cost in the RAM. It would be necessary to drill down into the detail work package and resource assignment source data to determine the breakout of direct and indirect costs (see Figure 1).
Figure 4: Fully Burdened RAM
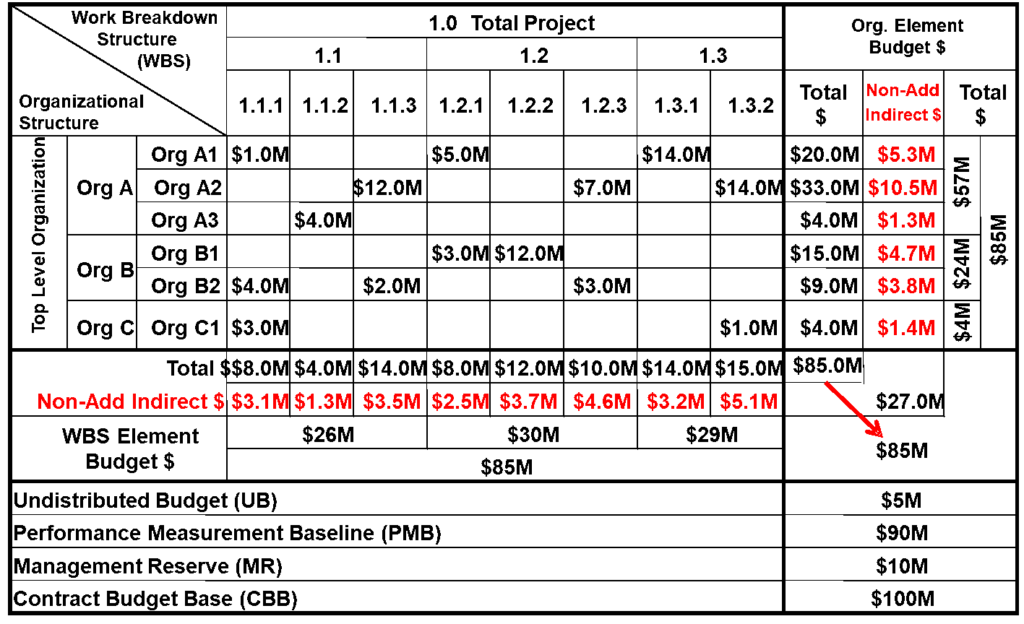
Fully Burdened RAM with Indirect Cost Summaries for WBS and Organizational Elements
What if the project manager takes a different approach to provide some visibility into the indirect costs? In Figure 5, the body of the RAM reflects the fully burdened (direct and indirect budgets) similar to Figure 4. Additionally, it also provides the total indirect cost summary for each major WBS element and organizational element, in what are called “Non-Add” entries.
Figure 5: Fully Burdened RAM with Indirect Cost Summaries for WBS and Organizational Elements
Indirect Cost Details in Project Performance Reports
How the project indirect cost information is summarized and displayed also applies to the formal contract performance reports. Customers often tailor the reporting requirements by specifying how they expect indirect costs to be separated out on the Integrated Program Management Report (IPMR) Formats 1, 2, and 7 or provided in the Integrated Program Management Data and Analysis Report (IPMDAR) Contract Performance Dataset (CPD) for visibility into the project’s direct and indirect costs.
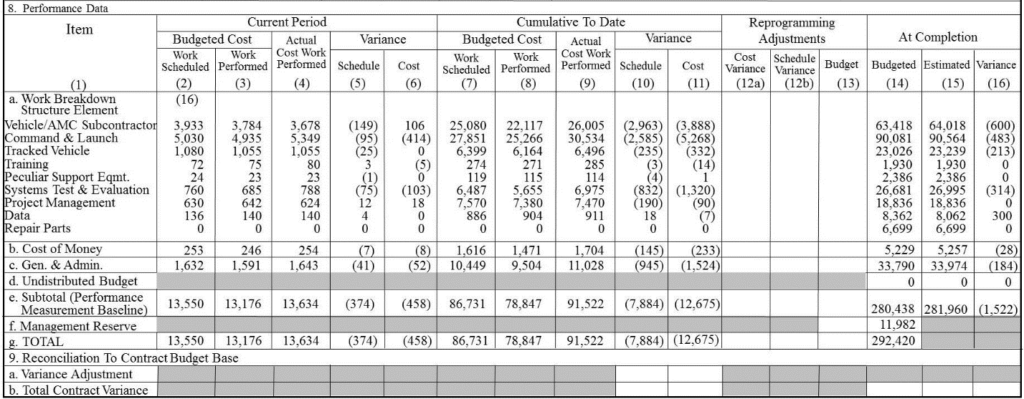
Example Partial IPMR Format 1
For illustration purposes, a partial example IPMR Format 1 is shown in Figure 6. This example illustrates the typical “default” detail in the body of the report (Block 8. Performance Data, a. Work Breakdown Structure Element). The columns include the direct costs plus other overheads (anything other than COM or G&A) for the WBS element rows. Rows 8. b. and 8. c. separate out the COM and G&A indirect costs at the project level.
Figure 6: Example Partial IPMR Format 1
This default layout provides limited visibility into the indirect costs of the project. Should the customer want more visibility into the contribution of the indirect costs on the project, tailoring options we often see specified in a contract include:
The body of the report displays the direct costs for the WBS elements and a summary line is added to provide visibility into indirect costs other than the COM and G&A, which are displayed at the total project level.
Similar to option 1, the body of the report displays the direct costs for the WBS elements. Instead of one summary line for the other indirect costs, there is a summary line for each indirect pool, as defined in the contractor’s CASB Disclosure Statement. For example, an Engineering indirect cost row, Manufacturing indirect cost row, Material indirect cost row, and Service indirect cost row.
For each WBS element in the body of report, there are additional rows that break out the direct cost and the indirect cost categories. Sometimes the direct costs are also broken down into the major element of cost categories such as labor, material, subcontract, and ODC.
When the customer requires additional indirect cost detail in the formal performance reports, note that the applicable narrative report (IPMR Format 5 or the IPMDAR Performance Narrative Report) will need to include a discussion on significant cost variances for those indirect cost categories when applicable. This is discussed further in the next blog.
Part 3 of this series of blogs will discuss the cost and schedule variance analysis process and how to determine who should be responsible for indirect cost variance analysis.