Earned Value Management System (EVMS)

Improving Integrated Master Schedule (IMS) Task Duration Estimates

, , , ,
Improving Integrated Master Schedule (IMS) Task Duration Estimates

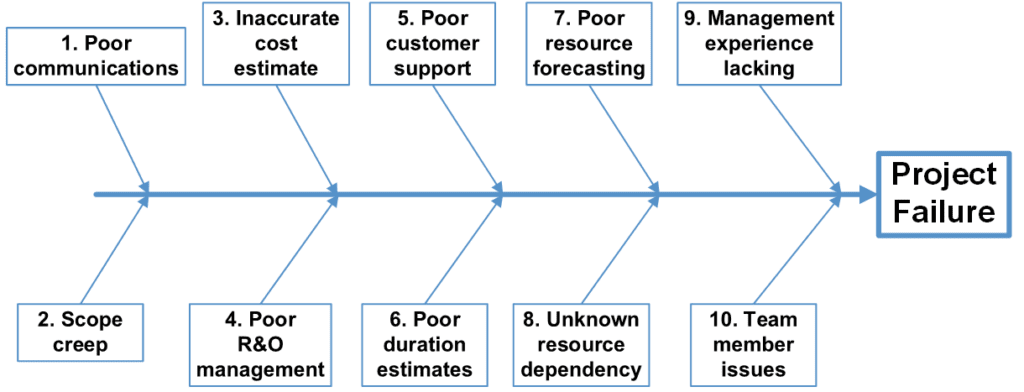
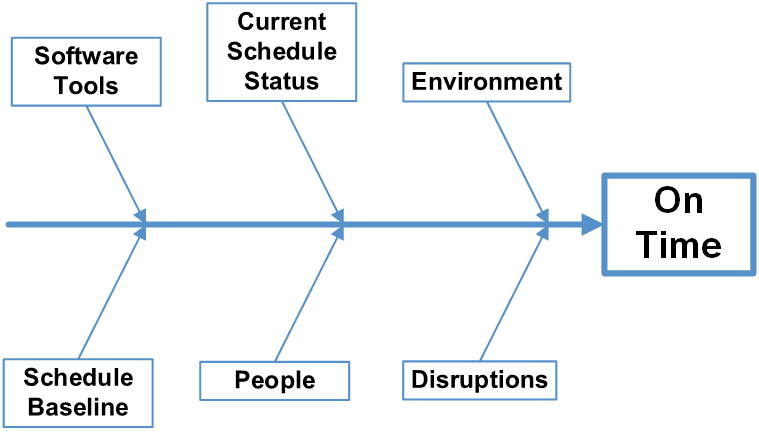
One of the top reasons projects fail is because of poor task duration estimating for an integrated master schedule (IMS). Without accurate and consistent estimates, project outcomes can become unpredictable, leading to missed deadlines, budget overruns, and overall project failure. A realistic schedule is required to place the necessary resources in the correct timeframe to adequately budget the work as well as to produce credible estimates to complete and to forecast completion dates. While missed deadlines and budget overruns are detrimental for any project, there can be additional business ramifications when producing schedules in an Earned Value Management System (EVMS) contractual environment.

While there are effective methods available to improve task duration estimates, they are often underutilized. A common reason for this oversight is the lack of time allocated to developing the project schedule and determining task durations.

During the proposal phase, initial durations are typically estimated at a more summary level than the detailed execution phase. The proposed work is often defined at a level one to two steps higher than where the actual tasks will be performed. After project initiation, the team’s initial effort is to break the work down into more manageable tasks. This decomposition is crucial for achieving more accurate estimates. It’s no surprise, then, that the initial breakdown efforts often result in duration estimates that don’t align with the proposed durations.

Parkinson’s Law tells us that work expands to fill the time available. If task durations are excessively long, costs will inevitably rise. To counter this, it’s important to require estimators to provide both the estimated effort and the duration needed to accomplish the task. This approach helps to gain a better understanding of the scope of the task and to avoid unrealistic estimates. If you see a task that requires 10,000 hours with a duration of 2 weeks, then you immediately would suspect something is wrong with the estimates.

Techniques for Developing More Accurate Task Duration Estimates

What are your options? H&A earned value consultants and senior master schedulers often employ the following techniques to help a client produce a more realistic IMS.

  1. Establish a Probability Goal. It is essential to set clear expectations for the estimating team. Without guidance, teams may default to estimates with a 50/50 probability of success, which is a recipe for failure. Instead, directing the team to aim for estimates within a 75% to 80% probability range can lead to better outcomes.
  2. Break Down Tasks. Decompose tasks into smaller, more manageable components. The further out the task’s horizon, the greater the variability in estimates. For example, asking someone to estimate the drive time from Washington, DC, to Boston without specifying the vehicle, route, limitations, or conditions introduces unnecessary uncertainty.
  3. Use Professional Judgment. Engage someone with experience in the specific type of work required for the task. A seasoned expert will provide more accurate duration estimates based on their knowledge and experience. Often, we ask the potential task manager to do the estimate, but that person may not be the one with the most related experience or knowledge about the work.
  4. Leverage Historical Data. If the task or a similar one has been done before, use that historical data to inform the estimate. This approach provides a realistic benchmark for future estimates.
  5. Use generative AI. If you have access to an AI capability along with access to historical data, that could be an option to leverage the source data using specific prompts to glean relevant information. As with all AI tools, always verify the generated results to ensure it is a useful basis to substantiate the estimate.
  6. Apply Parametric Estimating. When possible, use parametric analysis to estimate the durations. For example, if it took a specific number of days to clean up a certain amount of toxic waste under similar conditions, this data can be used to estimate the duration of a new but comparable task.
  7. Engage Multiple Estimators. Gathering estimates from more than one person helps to reduce individual biases and provides a more rounded estimate.
  8. Apply the Delphi Method. This technique involves three knowledgeable individuals providing estimates or three-point estimates. The initial estimates are analyzed, and the results are shared with the estimators without attributing specific values to any individual. After discussing the findings, the estimators revise their estimates based on the collective insights, leading to a more refined and accurate duration estimate.
  9. Use Three-Point Estimates. Ask estimators to provide best-case (BC), most likely (ML), and worst-case (WC) durations, along with their reasoning. Applying a formula like the Program Evaluation and Review Technique (PERT) duration formula (1BC+4ML+1WC)/6 can yield an adjusted and realistic estimate. You can vary the best and worst case estimate for risk if you have information on that.

    To see how this simple approach can work, walk through this exercise. Ask yourself how long it takes you to drive to work most of the time. Let’s say the answer is 45 minutes. Then ask yourself how long it would take on a Sunday morning in the summer when the roads were dry (the best case). Let’s say your answer is 25 minutes. Then ask yourself how long it would take on a Monday morning in the winter during a moderate snow event (the worst case). You tell yourself 90 minutes. Now you have enough information to calculate the PERT duration.

    Best Case = 25 minutes
    Most likely = 45 minutes
    Worst Case = 90 minutes
    PERT Duration = (25 + 180 + 90)/6 = 49 minutes

    Finally, let’s say you ask yourself how likely it is that you end up on the high side instead of the low side. If your answer is it is much more likely to encounter conditions that slow you down, you would modify the formula to use one and a half times the worst case (25 + 180 + 135)/6 = 57 minutes. That longer duration shows the impact of your impromptu risk analysis and provides a duration that has a much higher probability of being achievable.

    Now think about the same scenario but conducted by you interviewing three people who drive the same route to work. That would approximate the Delphi method.
  1. All or something less. It may not be necessary to analyze every task to the degree suggested. Even if you could do the analysis along the top several critical paths that would be an improvement. If you were to apply numerical factors to the tasks in related portions of the project that would be impactful. For example, all mechanical design tasks or all software development tasks.

What is the best approach?

You will need to analyze your project and determine which approach or approaches would yield useful information at a reasonable cost. If you apply your own thinking on how to improve your duration estimates, you will undoubtedly find a method most suitable for your situation. Depending on a project’s complexity and risk factors, you may also find it useful to take a more formal approach. Conducting a schedule risk assessment (SRA), a probabilistic assessment of a project’s outcome, can help you gain a better understanding of where the duration risk exists in the schedule.

H&A earned value consultants and scheduling subject matter experts often assist clients to establish basic guidance to help scheduling personnel to get into the habit of adequately defining tasks and using techniques to improve duration estimates. This is critical to be able to produce well-constructed and executable schedules to improve the likelihood of achieving project technical, schedule, and cost objectives.

H&A offers a range of project scheduling training workshops that can help schedulers to implement industry best practices. These workshops also cover how to take the next step to implement advanced scheduling techniques such as schedule risk assessments to ensure the schedule is realistic and achievable. H&A earned value consultants and master schedulers often provide one-on-one mentoring using the scheduling tool of choice to help scheduling personnel work through the learning curve of using advanced network scheduling techniques to produce executable schedules.  

Call us today at (714) 685-1730 to get started.

Improving Integrated Master Schedule (IMS) Task Duration Estimates Read Post »

Merging Earned Value Management System Descriptions

, , ,

Are there best practices that apply when a company with an approved/certified Earned Value Management System (EVMS) acquires another company that also has an approved/certified EVMS in place? What happens with the EVM System Descriptions as well as related processes and procedures? What about the various project control tools being used? How do you level set the project control proficiency levels of personnel using the EVMS? Schedule and cost level of detail and data architecture also come into play. For example, project performance data is often used at the corporate level for financial analysis, portfolio analysis, and external reporting and may require data to be organized in a specific manner. Is the EVMS providing reliable status, forecast completion date (FCD), and estimate at completion (EAC) information to management? 

What are your options?

H&A earned value consultants have observed different approaches and often assist companies with determining their strategy. Assuming you are the acquiring company, you could:

  1. Require the acquired company to use your EVMS. 
  2. Let them continue using their EVMS for an agreed upon timeframe or indefinitely.
  3. Take the best of both and establish a new and improved EVMS.  

Each option has its pros and cons. There are also other implications for at least the acquired company. DCMA will need to conduct an Integrated Baseline Review (IBR) and/or a compliance review if the acquired company’s EVMS assessment is no longer applicable. If you make significant modifications to your EVM System Description, DCMA will need to review the revised System Description to determine whether it still complies with the EIA-748 Standard for EVMS guideline requirements.

Things to Consider

  • What do you want to achieve?

    If the goal is to establish a common EVM System Description across the corporation, the strategy will need to reflect that. Define the business objectives that clearly articulate the benefits of using a standardized approach that can help to create and implement the plan to achieve your goal. In this example, that could narrow your path forward to either option 1 or 3 depending on the state of your EVMS.

  • What is the state of your current EVM design and System Description?

    Do you already have a best in class corporate level system in place? If yes, option 1 is a good fit. The strategy would be to create a plan to transition the acquired company to your EVMS. A single EVMS is easier to maintain and to train people on how to use it effectively. Commonality makes it easier to move personnel between projects.

    Perhaps your company is fine with different EVM Systems at a business unit level. For example, perhaps the business units have a different customer base (DoD versus DOE), and the requirements are different. In this case, it may make sense to go with option 2. We recommend being prepared to do an in-depth assessment of the acquired company’s EVMS to become familiar with it, gain an understanding of how project personnel use it, and evaluate the quality of the schedule and cost data. It is imperative that you have a good understanding of the strengths and weaknesses of the acquired company’s EVMS. You may find best in class practices that you could incorporate into your EVMS. On the other hand, you may discover issues you need to address with a corrective action plan. Some of them may be as simple as providing desktop instructions for the schedulers or control account managers (CAMs). The more difficult are actions taken to change the culture such as resistance to providing visibility into the data.

    Option 3 may be good path in situations where you know there are components in your EVMS that need to be streamlined or enhanced. It provides an opportunity to fix known issues with your EVM design or System Description. It could also be an opportunity to replace a mix of software tools or home-grown tools with a standard set of commercial off the shelf (COTS) schedule, cost, and analysis as well as risk tools. Integration with a standard Agile tool may also come into play. In this case, your strategy may be to create a working group from both companies to create a best in class corporate EVMS. 

  • Structure of the EVM System Description.

    There may be “layers” to it that makes it easier to accommodate unique business unit environments. For example, perhaps you have established a corporate level System Description that states what the company does to comply with the EIA-748 guidelines when an EVMS is contractually required or what is required to satisfy internal management needs for project/portfolio analysis (no external customer management system or reporting requirements). The corporate level system should define specific rules all business units are expected to follow. The business units define how they comply with the corporate requirements (their specific process). A good approach is to also allow project managers to define project directives to specify project unique requirements as long as they comply with the corporate and business unit requirements.

    In this example, option 1 is a good fit. The strategy would be to help the acquired company to establish revised EVM processes that align with the corporate requirements similar to other business units in the corporation.

Other Considerations

Your strategy and tactical plan must address identified risks and opportunities. A common challenge is resistance to change. A potential risk mitigation approach could be to bring in the acquired company’s personnel as part of a joint corporate management team with the goal to create a single best in class EVMS. It is essential to establish ownership in the new or revised process. An example from one H&A client illustrates the importance of taking ownership in the EVMS as part of a successful transition.

“We didn’t force what we had on them, nor did we give in. We have a corporate EVM System Description. When we acquired the company, we brought them in to do a revision of the System Description, as the decision was made that we will operate as one company. They are now using that System Description and are using the same EVM cost tool. We are working other initiatives to harmonize other systems. It was surprisingly not contentious. We incorporated their leads into the organization with minimal disruption. We also have corporate training, which they supported and some of their legacy folks are leading that. The company as a whole changed, rather than forcing our way on them. Not many major differences between us, but inclusion of the folks from the acquired company as well as business groups was key. Frankly, one of our legacy divisions was harder to work with than anyone from the company we acquired.” – EVMS Director, A&D Contractor

While this is an example of where things went well, your risk mitigation approach should be prepared for situations where the teams do not agree upon the documented process, tools, or training that could result in an impasse. Knowledge of the current internal environment and personnel mix can help to determine the best mitigation strategy. A strong leadership team must be in place to ensure teams are working to achieve common objectives and to amicably resolve differences with a target completion date.

The tactical plan must also include a robust training plan that covers the revised EVMS process, procedures, and any new tools. This is critical to ensure project personnel gain a good understanding of what changed, who is responsible for what, workflow, requirements such as data coding or level of data detail, and how to use the tools effectively. Role based training is often useful to ensure project control personnel, schedulers, CAMs, and others are following the documented procedures specific to their day-to-day tasks. Desktop instructions are also useful to ensure project personnel are using the software tools effectively in alignment with the documented process and procedures.

What to do if you find yourself in this situation?

It often helps to start with a gap analysis of your or the acquired company’s EVM design and System Description as well as assess how project personnel implement the system and the quality of the data. H&A earned value consultants often conduct an EVMS gap analysis to provide a fact-based and independent analysis of the EVMS, project personnel proficiency levels, and quality of the schedule and cost data. Once you are able to identify and quantify the strengths and weaknesses of the system, you are in a better position to determine your best strategy that aligns with your corporate business objectives and goals.

Over the years, H&A earned value consultants have observed first-hand what strategies and tactics for designing and implementing a best in class EVMS ensures success in a variety of business environments. We can also help you avoid common pitfalls that can derail the best laid plans – it is often the case a client didn’t realize there were hidden risks, or they had made incorrect assumptions.

We can help you determine the right strategy for your situation. Call us today at (714) 685-1730 to get started.

Merging Earned Value Management System Descriptions Read Post »

EVM and Unified Risk Management

, , , ,

Working with numerous clients, H&A earned value consultants have observed many instances where project management teams consider the risk and opportunity (R&O) management process to be something technical in nature, run by engineers and focused on the technical aspects of the project’s product. Meanwhile, there is often a separate risk process going on much less formally to consider risks in terms of the project’s schedule and cost goals. This bifurcated approach is a source of risk itself.

Procuring agencies such as the DoD, NASA, DOE, and others have published their own risk management guides. The Government Accountability Office (GAO) has various reports on this topic including examples of their findings. DCMA mentions risk in their Business Practice 4  Guideline Evaluation Template (GET) Process/Implementation Verification Points often used by contractors to check whether their earned value management system (EVMS) meets the intent of the EIA-748 Standard for EVMS guidelines. The exact questions asked by DCMA are important but the overall idea that risk and EVMS are co-dependent is the critical aspect. This is also true for the DOE. They identify risk management as one of the 10 subprocesses necessary for an EVMS.

Setting the Stage

Risk is defined as a factor, element, constraint, or course of action that introduces an uncertainty of outcome that should it occur, could negatively impact the ability to meet the project’s planned technical, schedule, or cost objectives. Negative impacts are sometimes called a threat where the objective is to mitigate the risk. A realized risk becomes an issue that must be resolved to minimize the impact. An opportunity is defined as a positive risk where the objective is to capture the beneficial impacts. Opportunities are not as common as threats.

R&O management is defined as the process of identifying, assessing, and responding to risks and opportunities throughout the project’s life cycle. The goal of R&O management is to identify potential risks and opportunities, determine the likelihood or probability the risk or opportunity will occur, and determine the impact should a risk be realized, or an opportunity is captured. Risks and opportunities are prioritized so that those with greater impact and a higher probability of occurring receive a greater share of resources and attention.

In this blog, we are using the term risk with a focus on the negative impacts or threats to a project.

Example of Common Project Risks and Risk Assessment Approach

H&A’s senior management routinely reviews literature, considers our work with clients, and discusses with our earned value consultants the main contributors to project failure. These findings are updated regularly and presented in H&A training materials as an Ishikawa Fishbone Cause and Effect diagram. Figure 1 is an example of this type of diagram. 

Figure 1: Example of an Ishikawa Fishbone Case and Effect Diagram

Figure 1: Example of an Ishikawa Fishbone Case and Effect Diagram

When this approach is used for risk assessments, each contributing risk is assessed, and the response documented. An example of a risk/response table is shown below for the first three identified risks.

Risk ItemGood Example of a Real Project Response to an Identified Risk
Poor communicationsGoals are known and documented. Communications plan is in place. Have an established cadence for weekly internal and customer meetings to quickly resolve issues. An internal project performance management dashboard is updated daily with current data. Updated IMS and risk register are broadcast weekly to the team. A strong business rhythm has been established.
Scope creepWork scope (requirements and SOW) are well defined and a change control process is in place. Performers are trained in spotting scope creep and how to handle potential changes in scope.
Inaccurate cost estimateImplemented a process enabling cost estimators to search historical actual cost data, identify analogous tasks, substantiate, and document the basis of estimate. For high risk areas, techniques such as the Delphi method, SMEs, and non-advocate reviews are used. Performance is constantly monitored to spot work elements where the actual costs do not align with the budgeted costs or the estimate at completion (EAC) is triggering internal variance at completion (VAC) thresholds. 

This same type of approach can be used by the project control team to create risk Ishikawa diagrams to identify technical risks that could impact the ability to achieve schedule and cost goals. Likewise, risk Ishikawa diagrams can be used to identify risks in the integrated master schedule (IMS) and time phased budget or estimate to complete (ETC) and EAC.

A Unified Approach to Risk

A unified approach includes technical, schedule, cost, and other risk identification and assessment that is an integral part of a contractor’s EVMS. R&O management should be integrated into the EVMS subsystems including work organization, planning and scheduling, work authorization and budgeting, management analysis and reporting, and change management. 

Identified risks are analyzed and quantified to develop a risk handling strategy. Where applicable, risk mitigation tasks have been entered into the IMS. Ideally a schedule risk assessment (SRA) has been completed to gain an understanding of duration risks that can help to improve the accuracy of the schedule. Assuming the IMS is resource loaded and leveled, the result is a more accurate time phased budget plan as it incorporates the risk handling strategies when the performance measurement baseline (PMB) is established. The R&O process also provides the necessary rationale for determining the budget amount set aside for management reserve (MR).

The R&O assessments should be a normal part of generating the Variance Analysis Reports (VARs) and updating the ETC and EAC. These assessments can also drive the need for processing baseline change requests (BCRs) as well as determining the best approach for corrective actions. 

Using Directed Searches of Identified Risks

To facilitate a unified approach, we recommend establishing a cadence of standing risk review sessions that are conducted in a methodical way to ensure the project manager, integrated product team (IPT) leads, control account managers (CAMs), schedulers, and financial analysts routinely walk through the identified risks that have the potential to impact the project’s IMS or time phased cost.

The intent is to establish a framework such as Ishikawa diagram to guide the risk review session, a directed search of the identified risks should anything further need to be addressed. It is important that a “does anyone have a risk to suggest” approach is not used. Every topic should be covered in every session by walking the Ishikawa risk items. Most of the time it will be a quick “no change” response. Separate Ishikawa diagrams could be used to guide the discussions for the contributing technical, schedule, and cost risks. The meeting room should have the ability to view the live IMS, cost data, and performance analysis data. Team members should be prepared to take notes during the meeting to compile action items.

Figure 2 is an example of a basic Ishikawa diagram of IMS risks the project control team could focus on for the risk review session. This would reflect the project control team’s identified risks to the IMS they routinely monitor.

Figure 2: Example of an IMS Ishikawa Fishbone Case and Effect Diagram

Figure 2: Example of an IMS Ishikawa Fishbone Case and Effect Diagram

For example, updating the current schedule every reporting period has the potential to compromise the integrity of the IMS to provide accurate forecast information about the project’s remaining work. Perhaps the project control team has identified a list of contributing schedule status risks, risk response, and example directed questions for each review meeting. These questions could be focused at the CAM level. The following table is a simple example. 

Risk ItemRisk ResponseExample Directed Questions
IMS critical or driving pathsVerify logic. Verify traceability exists and has not been damaged by updates. Review constraints, deadlines, and milestones. Perform data quality check, correct errors.Did milestones move? Did the end date move? What were the baseline dates for starts or finishes that fall into the period?What were the forecasted dates for starts and finishes that fall into the period?What did not happen? Why?
RealismCalculate and assess the Baseline Execution Index (BEI) and Current Execution Index (CEI). Compare the ratio of actual performance to the ratio of future performance.Is the BEI/CEI result within goals? Are there performance discrepancies? Does the forecast need to be updated to align with reality? Is the forecast showing the performance the team can achieve based on what has been achieved?
Quality of ETC/EACVerify updates are occurring. Compare current ETC/EAC to previous ETC/EAC.Has the ETC been updated? What changed and why? For example, for activities with material requirements, price or usage variances may impact the ETC/EAC. For activities with labor requirements, availability or personnel changes may impact future work effort ETC/EAC.

The same approach would be used for guided budget and cost risk discussions. Tailored cause and effect diagrams should be created for a company business environment and each project’s unique characteristics.

Interested in learning more?

H&A’s training courses purposely include content on R&O management and integrating it into the EVMS. H&A’s Project Scheduling as well as Advanced Earned Value Management Techniques (AEVMT) workshops in particular include more discussion on R&O topics.

A company’s EVMS should be designed to aid the identification and management of risks and opportunities. For example, during the process of developing the schedule and budget baseline, activity durations, resource requirements, and budget distribution can be refined to reflect identified and assessed risks. Proactively identifying and managing risks improves project performance. The expectation of specific risks occurring leads to contingency plans that lower the likelihood and impact of risks as well as the establishment of schedule margin and MR to address identified and assessed risks.

Call us today at (714) 685-1730 to get started.

EVM and Unified Risk Management Read Post »

Introduction to the Cost and Software Data Reporting (CSDR) Reporting Requirements

, , ,

A common client request is to assist them with sorting through the various DoD contractual reporting requirements and contract value reporting thresholds that apply. We frequently run into situations where a contractor needs clarification on why they have a Cost and Software Data Reporting (CSDR) requirement and whether they should seek to waive the requirement. Subcontractors to a prime often question the requirement to provide actual cost data directly to the DoD, especially for Firm Fixed Price (FFP) contracts.

Background

CSDRs are the primary means the DoD uses to collect data on the development, production, and sustainment costs incurred by contractors performing DoD acquisition contracts. It is a DoD system for collecting actual costs, software data, and related business data. The resulting data repository serves as the primary source for contract cost and software data for most DoD resource analysis efforts including cost database development, applied cost estimating, cost research, program reviews, analysis of alternatives (AoAs), and life cycle cost estimates.

CSDR reporting requirements are determined by the contract value regardless of the acquisition phase and contract type. In general, CSDR reporting is required for Acquisition Category I-II programs and Information System (IS) programs valued at more than $50M. They can also be required for Middle Tier Acquisition programs (greater than $20M) and other programs (greater than $100M). Risk can also be a determining factor regardless of the contract value.

DoD Instruction (DoDI) 5000.73, Cost Analysis Guidance and Procedures (March 2020), provides additional details about the cost data reporting. Table 1 in the 5000.73 lists the cost reporting requirements contract value thresholds. The DoD Manual 5000.04 Cost and Software Data Reporting (May 2021) is the primary requirements document for the development, implementation, and operation of the DoD CSDR system to ensure data reported is accurate and consistent.

About CADE

The Office of the Secretary of Defense Cost Assessment and Program Evaluation (OSD CAPE) established the Cost Assessment Data Enterprise (CADE), a secure web-based information system that hosts the controlled unclassified CSDR repository, the Defense Acquisition Cost Information Management System, and the forward pricing rate library. CADE also contains a selected acquisition report database, a contracts database, data analytics capabilities, and a library containing cost estimating content such as cost analysis requirement descriptions and cost estimates. CADE is access-controlled, and available through the public-facing CADE Portal website.

Similar to the cost estimating and proposal pricing functions within contractor’s organizations that rely on historical actual costs to assess the validity of a proposed cost estimate, independent and sound cost estimates are vital for effective DoD acquisition decision making and oversight. CADE plays a critical role in capturing the expenditure, technical, and programmatic data after contract execution in a consistent manner to enable independent cost estimating and analysis. This cost estimate data is essential to support efficient and effective resource allocation decisions throughout the planning, programming, budgeting, and execution process for the DoD.

CSDR Reporting Requirements

There are a series of Data Item Descriptions (DIDs) for this reporting requirement.  Some forms are submitted electronically using DoD defined XML schemas, Excel, or JSON encoded data in accordance with a File Format Specification (FFS) and Data Exchange Instruction (DEI). The list of DIDs are as follows. These DIDs can be downloaded from the CADE website.

  • Contract Work Breakdown Structure, DI-MGMT-81334D (May 2011).
  • Cost Data Summary Report, DI-FNCL-81565C (May 2011), DD Form 1921, XML Schema.
  • Functional Cost-Hour Report, DI-FNCL-81566C (September 2015), DD Form 1921-1, XML Schema.
  • Progress Curve Report, DI-FNCL-81567C (May 2011), DD Form 1921-2, XML Schema. 
  • Sustainment Functional Cost-Hour Report, DI-FNCL-81992 (May 2011), DD Form 1921-5, XML Schema.
  • Contractor Business Data Report, DI-FNCL-81765C (March 2021), DD Form 1921-3, Excel. 
  • Software Development Report, DI–MGMT-82035A (October 2022), DD Form 3026-1, XML Schema. 
  • Software Maintenance Report, DI–MGMT-82035A (October 2022), DD Form 3026-2, XML Schema.
  • Enterprise Resource Planning (ERP) Software Development Report, DI-MGMT-82035A (October 2022), DD Form 3026-3, XML Schema.
  • Cost and Hour Report (FlexFile), DI-FNCL-82162 (November 2017), JSON encoded data file following FFS and DEI.
  • Quantity Data Report, DI-MGMT-82164 (November 2017), JSON encoded data file following FFS and DEI.
  • Maintenance and Repair Parts Data Report, DI-MGMT-82163 (November 2017), Excel.
  • Technical Data Report, DI-MGMT-82165 (November 2017), Excel.

The Cost and Hour Report (FlexFile) and Quantity Data Report play a critical role in collecting cost data from contractors for the DoD data repository because they use JSON data encoding to organize the content. They are intended to replace the legacy 1921 series of paper-based formats including the DD 1921, 1921-1, 1921-2, and 1921-5. It also requires contractors to provide significantly more historical cost data than the 1921 formats. As a result, the DoD cost estimating community has additional insight into historical costs. The goal is to establish a common framework and standard nomenclature to collect data from different contractors, all of them with unique cost accounting structures, that are mapped to the DID, FFS, and DEI requirements for use in the data repository.

Establishing a Consistent, Repeatable Process to Produce the CSDR Data Deliverables

For contractors new to the CSDR reporting requirements and in particular, the FlexFile JSON data encoding, can appear to be daunting. That’s where software tools such as those from Midnite Dynamics can help. Midnite Dynamics specializes in assisting contractors with producing the CSDR data deliverables. 

Their software tool, C*CERT+, streamlines, automates, validates, and produces the legacy 1921 family of Excel and XML reports as well as the FlexFile and Quantity Data Report JSON submittals. C*CERT+ eliminates what otherwise is a manually intensive, resource draining, tedious and costly effort subject to recurring rejections. It is one thing to create the required legacy reports or FlexFile JSON files for submittal, it is another to pass the submittal validation process. C*CERT+ provides numerous data validations and analysis reports to ensure the data is 100% compliant before it is submitted. For example, the software includes over 90 FlexFile validations to ensure data compliance as illustrated in Figure 1.

Figure 1: Example of FlexFile data validation results.

The software includes a Validation and Remarks utility to analyze the source data details that could result in a Validation Trip. Remarks can be entered directly into the validation module for anything that requires an explanation. This is illustrated in Figure 2. This narrative is included with the data submittal.

Figure 2: Example of providing remarks about the FlexFile data content.

C*CERT+ also interfaces with existing EVM cost tools and accounting systems to produce the existing legacy 1921 reports, the FlexFile, and other data submittals as well as to consolidate separate projects/CLINs/task orders into a single contract report.

Once the C*CERT+ Standard Category Mapping Rules are set up, they can be shared throughout the corporation or business unit to establish a standard and repeatable process for producing the data deliverables. This mapping process translates the contractor’s source data into an output that matches the CSDR data submittal format rules. This saves a tremendous amount of time and makes it much easier to consistently produce the CSDR data deliverables. An example of the Mapping Rules is illustrated in Figure 3.

Figure 3: Mapping Rules translate contractor unique cost data into a format that matches the CSDR data submittal requirements.

Do your process and procedures or training materials need an update to include specific guidance for project control teams to produce required DoD contractual reports or data submittals using your tool sets of choice? Give us a call today at (714) 685-1730 to get started. 

Introduction to the Cost and Software Data Reporting (CSDR) Reporting Requirements Read Post »

Formal Reprogramming: OTB or OTS Best Practice Tips

, , , ,
Formal Reprogramming: OTB or OTS Best Practice Tips

As a result of an Earned Value Management System (EVMS) compliance or surveillance review, the Defense Contract Management Agency (DCMA) or DOE Office of Project Management (PM-30) may issue a corrective action request (CAR) to a contractor. H&A earned value consultants frequently assist clients with developing and implementing corrective action plans (CAPs) to quickly resolve EVMS issues with a government customer.

A recent trend our earned value management consultants have observed is an uptick in the number of CARs being issued related to over target baselines (OTB) and/or over target schedules (OTS). On further analysis, a common root cause for the CAR was the contractors lacked approval from the contracting officer to implement the OTB and/or OTS even though they had approval from the government program manager (PM).

So why was a CAR issued?  It boils down to knowing the government agency’s contractual requirements and EVMS compliance requirements.

What is an OTB/OTS and when it is used?

During the life of a contract, significant performance or technical problems may develop that impact schedule and cost performance. The schedule to complete the remaining work may become unachievable. The available budget for the remaining work may become decidedly inadequate for effective control and insufficient to ensure valid performance measurement. When performance measurement against the baseline schedule and/or budgets becomes unrealistic, reprogramming for effective control may require a planned completion date beyond the contract completion date, an OTS condition, and/or a performance measurement baseline (PMB) that exceeds the recognized contract budget base (CBB), an OTB condition.

An OTB or OTS is a formal reprogramming process that requires customer notification and approval. The primary purpose of formal reprogramming is to establish an executable schedule and budget plan for the remaining work. It is limited to situations where it is needed to improve the quality of future schedule and cost performance measurement. Formal reprogramming may be isolated to a small set of WBS elements, or it may be required for a broad scope of work that impacts the majority of WBS elements.

Formal reprogramming should be a rare occurrence on a project and should be the last recourse – all other management corrective actions have already been taken. Typically, an OTB/OTS is only considered when:

  • The contract is at least 35% complete with percent complete defined as the budgeted cost for work performed (BCWP) divided by the budget at completion (BAC);
  • Has more than six months of substantial work to go;
  • Is less than 85 percent complete; and
  • The remaining management reserve (MR) is near or equal to zero.

A significant determining factor before considering to proceed with a formal reprogramming process is the result from conducting a comprehensive estimate at completion (CEAC) where there is an anticipated overrun of at least 15 percent for the remaining work.

When an OTB is approved, the total allocated budget (TAB) exceeds the CBB, this value referred to as the over target budget. Figure 1 illustrates this.

Before Over Target Baseline
Figure 1 – Over Target Baseline Illustration

When an OTS is approved, the same rationale and requirements for an OTB apply. The planned completion date for all remaining contract work is a date beyond the contract completion date. The purpose of the OTS is to continue to measure the schedule and cost performance against a realistic baseline. The process must include a PMB associated with the revised baseline schedule. Once implemented, the OTS facilitates continued performance measurement against a realistic timeline.

Contractual Obligations

An OTB does not change any contractual parameters or supersede contract values and schedules. An OTS does not relieve either party of any contractual obligations concerning schedule deliveries and attendant incentive loss or penalties. An OTB and/or OTS are implemented solely for planning, controlling, and measuring performance on already authorized work.

Should you encounter a situation where it appears your best option is to request an OTB and/or OTS, the DoD and DOE EVMS policy and compliance documents provide the necessary guidance for contractors. It is imperative that you follow agency specific guidance to prevent being issued a CAR or your OTB/OTS request being rejected.

DoD and DOE both clearly state prior customer notification and contracting officer approval is required to implement an OTB and/or OTS. These requirements are summarized the following table.

ReferenceDoD/DCMA1DOE
RegulatoryDFARS 252.234-7002 Earned Value Management System
“(h) When indicated by contract performance, the Contractor shall submit a request for approval to initiate an over-target baseline or over-target schedule to the Contracting Officer.”
Guide 413.3-10B Integrated Project Management Using the EV Management System
6.1.2 Contractual Requirements.
“…if the contractor concludes the PB TPC and CD-4 date no longer represents a realistic plan, and an over-target baseline (OTB) and/or over-target schedule (OTS) action is necessary. Contracting officer approval is required before implementing such restructuring actions…”
Attachment 1, Contractor Requirements Document
“Submit a request for an Over-Target Baseline (OTB) or Over-Target Schedule (OTS) to the Contracting Officer, when indicated by performance.”
EVMS Compliance2Earned Value Management System Interpretation Guide (EVMSIG)3
Guideline 31, Prevent Unauthorized Revisions, Intent of Guideline
“A thorough analysis of program status is necessary before the consideration of the implementation of an OTB or OTS. Requests for establishing an OTB or an OTS must be initiated by the contractor and approved by the customer contracting authority.
EVMS Compliance Review Standard Operating Procedure (ECRSOP), Appendix A, Compliance Assessment Governance (CAG)
Subprocess G. Change Control
G.6 Over Target Baseline/Over Target Schedule Authorization
“An OTB/OTS is performed with prior customer notification and approval.”
See Section G.6 for a complete discussion on the process.
Contractor EVM SD4DCMA Business Process 2  Attachment, EVMS Cross Reference Checklist (CRC), Guideline 31.
“b. Are procedures established for authorization of budget in excess of the Contract Budget Base (CBB) controlled with requests for establishing an OTB or an OTS initiated by the contractor, and approved by the customer contracting authority?”
DOE ESCRSOP Compliance Review Crosswalk (CRC), Subprocess Area and Attribute G.6
“Requests for establishing an OTB or an OTS are initiated by the contractor and approved by the customer contracting authority.”

Notes:

  1. When DoD is the Cognizant Federal Agency (CFA), DCMA is responsible for determining EVMS compliance and performing surveillance. DCMA also performs this function when requested for NASA.
  2. Along with the related Cross Reference Checklist or Compliance Review Crosswalk, these are the governing documents the government agency will use to conduct compliance and surveillance reviews.
  3. For additional guidance, also see the DoD EVM Implementation Guide (EVMIG) , Section 2.5 Other Post-Award Activities, 2.5.2.4 Over Target Baseline (OTB) and Over Target Schedule (OTS). The EVMIG provides more discussion on the process followed including the contractor, government PM, and the contracting authority responsibilities.
  4. Your EVM System Description (SD) should include a discussion on the process used to request an OTB/OTS. The EVM SD content should be mapped to the detailed DCMA EVMS guideline checklist or the DOE Compliance Review Crosswalk (subprocess areas and attributes) line items.

Best Practice Tips

The best way to avoid getting a CAR from a government agency related to any OTB or OTS action is to ensure you have done your homework.

  • Verify your EVM SD, related procedures, and training clearly defines how to handle this situation. These artifacts should align with your government customer’s EVMS policy and regulations as well as compliance review guides, procedures, and checklists. Be sure your EVM SD or procedures include the requirement to notify and gain approval from the government PM and contracting officer, as well as what to do when the customer does not approve the OTB or OTS. Also discuss how to handle approving and managing subcontractor OTB/OTS situations; the prime contractor is responsible for these actions. Your EVMS training should also cover how to handle OTB/OTS situations. Project personnel should be aware of contractual requirements as well as your EVMS requirements and be able to demonstrate they are following them.
  • Maintain open communication with the customer. This includes the government PM as well as the contracting officer and any other parties involved such as subcontractors. Requesting an OTB or OTS should not be a surprise to them. Verify a common agreement has been reached with the government PM and contracting officer that implementing an OTB or OTS is the best option to provide visibility and control for the remaining work effort.
  • Verify you have written authorization from the government PM and the contracting officer before you proceed with implementing an OTB or OTS. You will need this documentation for any government customer EVMS compliance or surveillance review. Your baseline change requests (BCRs) and work authorization documents should provide full traceability for all schedule and budget changes required for the formal reprogramming action.

Does your EVM SD or training materials need a refresh to include sufficient direction for project personnel to determine whether requesting an OTB or OTS makes sense or how to handle OTB/OTS situations? H&A earned value consultants frequently help clients with EVM SD content enhancements as well as creating specific procedures or work instructions to handle unique EVMS situations. We also offer a workshop on how to implement an OTB or OTS .  Call us today at (714) 685-1730 to get started.

Formal Reprogramming: OTB or OTS Best Practice Tips Read Post »

Comparing the Efficacy of Independent Estimate at Completion (IEAC) Methods Using Real Project Data

Comparing the Efficacy of Independent Estimate at Completion (IEAC) Methods Using Real Project Data

“Data! Data! Data!” he cried impatiently. “I can’t make bricks without clay.”

-Sherlock Holmes, The Adventure of the Copper Beeches

There are many discussions about EACs and evaluating EACs including using Independent EAC (IEAC) formulae to compare with the contractor EACs. With good reason, we should wonder how accurate are those IEACs that we use so often and sometimes make decisions based on them. Are we misjudging contractor’s EACs based on formulae that are weak or inappropriate?

Humphreys & Associates has initiated a study to determine how accurate IEACs are, and we would like your help. The study will compare different IEAC formulae against the Program Manager (PM) most likely EAC at the 25, 50, and 75 percent complete point for completed projects. The objective is to assess how closely the IEACs and PM most likely EAC were able to predict the final cost outcome for the project.

How Accurate are IEAC Formulae?

Many formulae exist for using recorded data from an earned value management system (EVMS) to make independent estimates of the final cost at completion (EAC) for the element in question. The element might be a control account, a Work Breakdown Structure (WBS) element, or even an entire project.

What is not known is how accurate these methods are at forecasting the final actual cost for the project. This study hopes to determine that answer.

Real World IEAC Data

This study was initiated by collecting earned value data from 12 completed projects. We need projects that are completed because, on a completed project, the final actual outcome is known. We collected project data at the 25, 50, and 75 percent complete points. At each of these points, the IEAC formulae were applied to determine how closely they were able to predict the final actual cost outcome for the project. The quest is to learn how the various IEACs performed. Is any one of them more accurate than the others?

From this investigation, any indication of the relative efficacy of the formulae would be used to inform future use of the IEAC methods.

Our Method for Testing IEACs

In general, the IEAC approach is to use existing recognized formulae. We have chosen these IEACs as a starting point:

  • IEAC 1 = BAC/CPIe at the percent point reported. This formula can be stated in words as “the entire project is performed at the same efficiency as experience to date.”
  • IEAC 2 = ACWP + [BCWR/CPI (.5) + SPI (.5)]. This formula uses weighted SPI and CPI which theoretically allows for sensitivity to both cost and schedule historical performance. The weights used in this application are even at .50 and .50.
  • IEAC 3 = ACWP + [BCWR/CPI x SPI]. This formula uses the SPI and CPI multiplied together which theoretically allows for sensitivity to both cost and schedule performance to date.
  • IEAC 4 = ACWP + BCWR. This formula assumes the remaining work will be done as budgeted with no factoring.

One additional non-traditional IEAC will be used.

IEAC 5 = Use of IEAC 2 weighted SPI and CPI but decreasing the proportion applied to the SPI as the percent of project completion increases. In other words, the impact of schedule performance diminishes as the project becomes closer to completion.

We will also take the average of all the formulae to see how that works.

Initial Data Set

One aerospace contractor and one US Government agency have provided the required data for 12 completed projects with an interest in the outcome of the study. The source of the data and the specific projects will not be disclosed in the study.

These real-world projects did not have an exact 25%, 50%, or 75% dataset. The closest dataset to each of those completion percentages was used. One example dataset looks like this (color coding should be ignored):

Example Product Data

How can you help?

We need more project data to gather enough varying project outcomes to make the test realistic. We do not plan to keep the types of projects or products separate but will take all the data we can get and look at them all.

Please consider providing data for the study. We have created an Excel spreadsheet template to help gather project data in a common format for analysis. You can download this template here. Add as many tabs as needed for each project. Send your completed spreadsheet to humphreys@humphreys-assoc.com.

In a separate blog we will outline other help we need to complete the study and to analyze the results.

Comparing the Efficacy of Independent Estimate at Completion (IEAC) Methods Using Real Project Data Read Post »

Scroll to Top