Video Release – Assessing Schedule Risk Using Deltek’s Acumen Risk 6.1 | Part 2 of 2
Video Release – Assessing Schedule Risk Using Deltek’s Acumen Risk 6.1 | Part 2 of 2 Read Post »
Before a project is ready to be baselined, a typical question the customer asks the project manager is, “How confident are you that the project will finish on time?”
This is a more difficult question than you might think. In competitive environments, guessing is not an option. The probability of success on a project must be quantified. The risks that impact the odds for success must also be quantified. If the risk is managed, the probability of completing the project on time and under budget is improved.
Customers are not blind to the importance of risk management. This is evidenced by recent changes in government contracting requirements that call for formal risk assessments of project schedules. Even if risk management were not a contractual requirement, it would be irresponsible for any project manager to ignore the need for risk management and proceed without identifying and assessing the project’s risks.
Schedule risk exists in every project. This risk can be quantified, analyzed, and mitigated, or it can be ignored. However, ignoring schedule risk does not make it go away. Fortunately, there are advanced software tools, such as Deltek’s Acumen Risk, that can help model the expected impacts of risk in the schedule. Then, the answer to “how confident are you that the project will finish on time?” can be answered with quantifiable information.
In the following sections, a few of the foundational elements of performing a schedule risk assessment (SRA) using Acumen Risk 6.1 will be discussed. The software was designed with the understanding that not everyone is an expert in schedule risk analysis. The software provides beginners with an easy to follow path to perform in-depth schedule risk analysis as well as advanced features for experienced risk experts.
Along with quick start guides and help documentation, the menu structure is laid out like a schedule maturity timeline. From left to right, the menu selections take one from the start-up steps of importing the schedule, to analyzing the schedule, assessing schedule risk, accelerating the schedule, and advanced customization features.
![]() Deltek Acumen – Top-Level Menus
Deltek Acumen – Top-Level Menus
Before delving into schedule risk assessments, let’s take one minor detour from risk into schedule diagnostics.
Would you trust a broken watch to tell you the correct time? The same goes for a schedule risk assessment. A broken schedule network cannot be trusted to yield reliable, and therefore actionable, SRA results.
The National Defense Industrial Association (NDIA) Integrated Program Management Division (IPMD) Planning & Scheduling Excellence Guide (PASEG), is widely regarded as one of the premier references on scheduling best practices. The PASEG was created by a joint team of both government and industry scheduling experts, thus it has no particular point of view to promote or defend. One of the scheduling best practices the PASEG discusses is that the integrated master schedule (IMS) should be validated before any SRA is performed. “Validated” means that the tasks, logic, durations, constraints, and lags in the IMS should be analyzed and corrected as necessary.
Acumen Fuse provides a complete set of schedule diagnostics. When I first clicked on the “Diagnostics” tab, I saw an initial set of metrics.
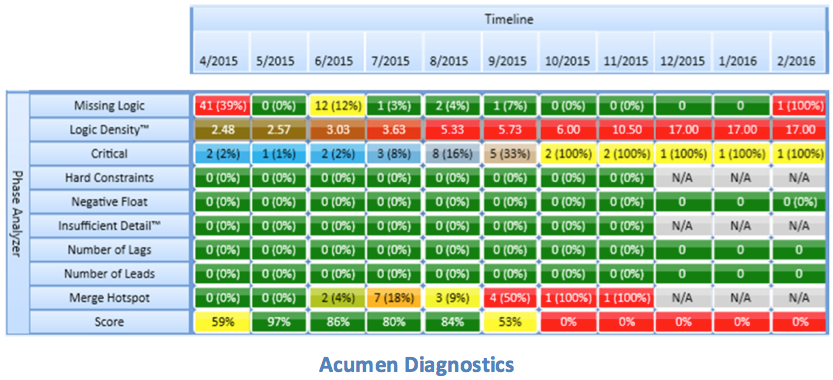
Each one of these metrics was applied to the project’s timeline that which makes it easy to see both where and when the issues occur. What I did not notice at first was that these metrics were just one subset; I was only looking at the “Schedule Quality” subset of the diagnostics. There were similar subsets in the areas of Logic, Duration, Constraints, Float, and the DCMA 14-point Schedule Assessment, just to name a few. All of these diagnostic tests can be modified to reflect your company or customer’s standards.
Before leaving the topic of schedule health, there are a few words of caution. No matter how useful a schedule analysis tool may be, there is no substitute for the task managers taking ownership of the IMS and ensuring that it is in good working order. For example, analysis software can be used to check to determine if a task has a predecessor and a successor, but only someone familiar with the effort can determine if a task has the “correct” predecessor and successor. Analysis software is becoming more and more sophisticated, but people still control the success or failure of the project.
Once a sound schedule has been developed, the next foundational elements of an SRA are the duration uncertainty estimates. There are two widely accepted methods of assigning duration uncertainty.
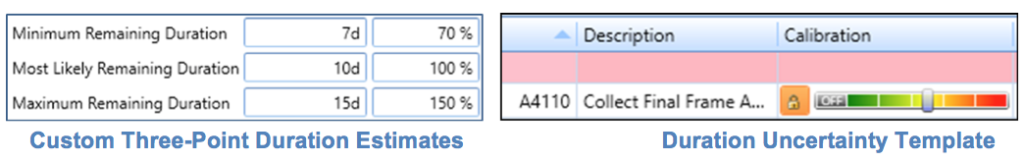
The preferred and more precise method is to obtain three-point duration estimates (best case, worst case, and most likely) from the task owners. At a minimum, this should be performed on all critical and near-critical tasks (and driving and near-driving tasks supporting significant events). For larger schedule networks, it may not be reasonable to gather this type of information for every task. If custom three-point estimates are not available, templated duration uncertainty could be applied based on the type of work, the task owner, historical performance, or any other applicable task characteristic.
Acumen Risk handles both methods very easily. Custom three-point estimates can be entered for each task in days (or hours), or as a percentage of the current remaining duration of the task. Standard duration uncertainty templates are easily applied to a task by selecting the appropriate risk level on the calibration bar. To streamline the process, by setting the calibration at any summary level, the uncertainty template is cascaded down to all the “children” tasks.
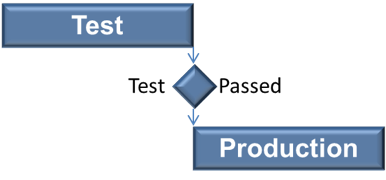
One thing traditional Critical Path Method (CPM) networks do poorly is model unexpected results. For example, if there is a 90% success rate on fatigue testing, the IMS will generally be constructed to assume the test will be successful, with no disruption to downstream tasks.
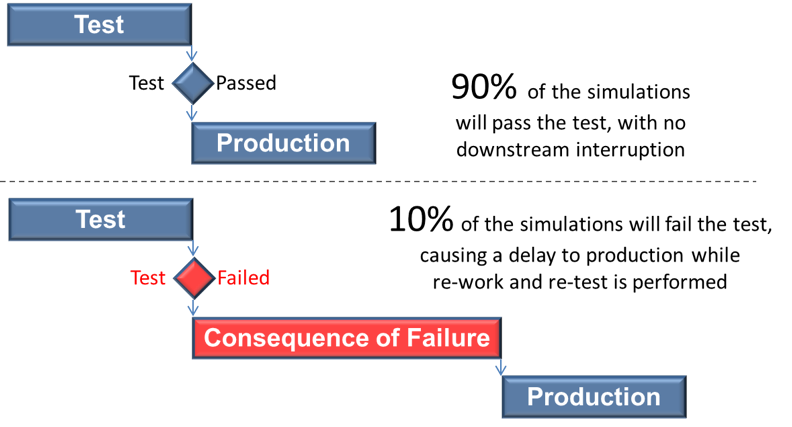
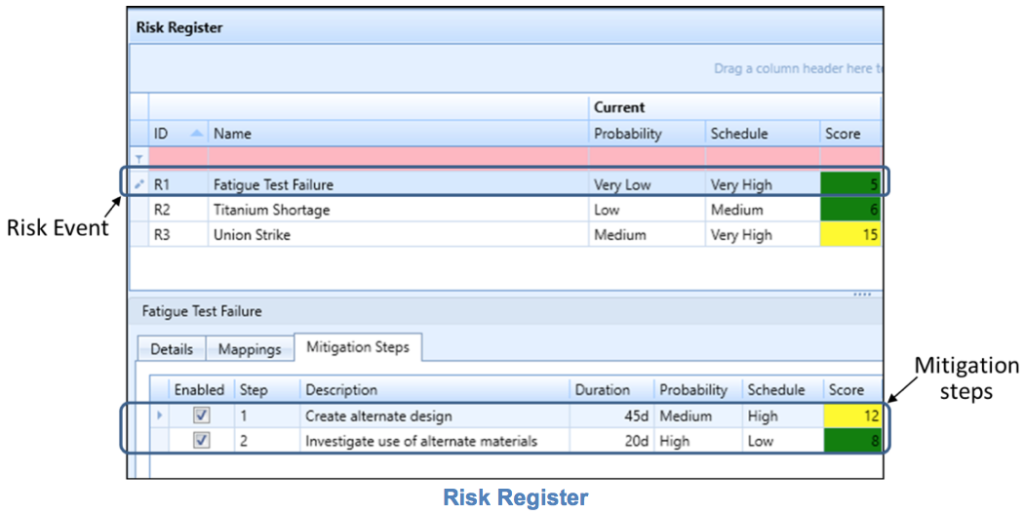
But what happens if the test fails? While unlikely, there is still a very real possibility that the results will be unfavorable. If the test does return unfavorable results, there will likely be a significant delay while re-work is performed in the areas of design, build and test. A traditional CPM network can model a successful test or an unsuccessful test, but not both. This is not a problem with a schedule risk assessment. Information from the project’s risk register can be used to model the likelihood of a test failure, as well as the consequence, or delay to downstream tasks resulting from that failure.
Is this an acceptable risk? An SRA can quantify the risk and provide information on the likelihood of successful deliveries. Acumen does not stop there though. One of its newest features is to organize and track all risk events within its built-in risk register, as well as to track the steps being taken to help mitigate that risk. Or, if your organization already maintains an external risk register in Excel, it can be imported into Acumen to eliminate the duplicate tracking of risk events. Whether the risk register is imported from Excel or built from scratch within Acumen, a single risk event can then be mapped to one or more activities, or a single activity can be associated with one or more risk events.
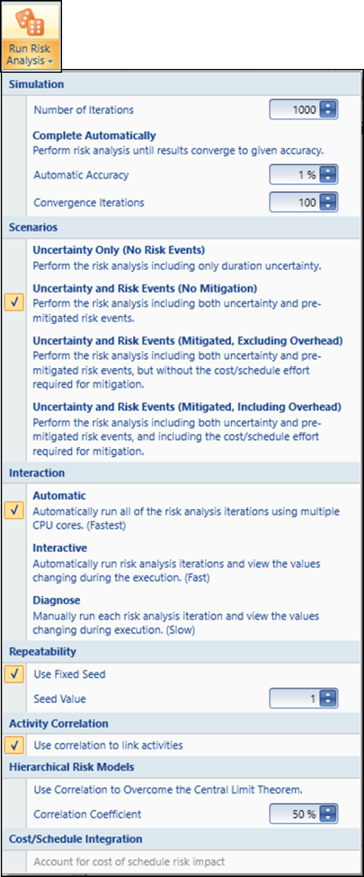
A typical SRA uses Monte Carlo techniques to simulate hundreds or thousands of potential project outcomes using the risks and uncertainties that have been supplied.
For most users, simply accepting the default settings and pushing the “Run Risk Analysis” button would be sufficient. But if terms like “Convergence”, “Correlation Coefficient”, “Central Limits Theorem” and “Seed Value” are part of your normal working environment, Acumen provides a variety of settings that can be customized to tune the SRA to best model your project.
No matter which approach you take, the Acumen toolset provides a quick and easy simulation process.
Part 2 of this blog will delve into the interpretation of SRA results.
Yancy Qualls, PSP
Engagement Director, Schedule Subject Matter Expert (SME)
Humphreys & Associates, Inc.
Assessing Schedule Risk Using Deltek’s Acumen Risk 6.1 | Part 1 of 2 Read Post »
Variance Analysis “provides EVMS contract management with early insight into the extent of problems and allows corrective actions to be implemented in time to affect the future course of the program.” [NDIA ANSI EIA 748 Intent Guide] Department of Defense Data Item Descriptions: DI-MGMT-81861, Integrated Program Management Report (IPMR) paragraphs 3.6.10xx; DI-MGMT-81466A, Contract Performance Report, paragraph 2.6.3; and DI-MGMT-81650, Integrated Master Schedule (IMS) — paragraph 2.5 — all require analysis for significant variances including cause, impact and corrective action plans. By comparing the performance against the plan, it is possible to make mid-course corrections which assist completion of the project on time and within the approved budget. The Variance Analysis Report (VAR) is a “living, working document to communicate cause, impact and corrective action”. [See: Chapter 35 Variance Analysis and Corrective Action, Project Management Using Earned Value, Humphreys & Associates, page 707.] Well-written variance analyses should answer the basic questions of why, what and how.
Cause is also known as root cause, nature of the problem, problem statement, issue, or problem definition. Root cause is the fundamental reason for the problem. Root cause is required in order to take preventative corrective action. The explanation of the variance is broken down into each of its components: discuss schedule variances separately from cost variances; discuss labor separately from non-labor; discuss which portion of the variance was caused by efficiency (hours) and which portion was because of dollars (rates) or if the variance was driven by material discuss how much was because of price and how much was because of usage. For more information refer to Humphreys & Associates blog Variance Analysis-Getting Specific.
Once the root cause of the problem has been identified and described, the impact(s) on the project should be addressed. Identify impacts to customers, technical capability, cost, schedule (including when the schedule variance will become zero), other control accounts, program milestones, subcontractors, and the Estimate at Completion, including rationale.
A corrective action (CA) plan should be developed that describes the specific actions being taken, or to be taken, which includes the individual or organization responsible for the action(s). The corrective actions should be directly derived from root cause analysis and related to each identified root cause. Results from previous corrective action plans should be included. Occasionally, a successful plan will include interim modifications or fixes in the short term, with long term changes identified as well. When no corrective action for an overrun is possible, an explanation and EAC rationale should be included. A corrective action log should be used that tracks the actions taken and the status of the corrective plan for each variance analysis cycle. As was stated in the Humphreys & Associates article: Corrective Action Response: Planning and Closure – Part 2 of 2 “It is critical that verification methods, objective measures, metrics, artifacts, and evidential products are identified that will verify that the corrective actions are effective.” Corrective action plans based on clearly a defined root cause facilitates time management action and avoids the occurrence of repetitive problems.
Variance Analysis, Corrective Action Plans, Root Cause Analysis Read Post »

A Variance Analysis Report (VAR) that includes specific information about the cause, impact, and corrective action “provides management with early insight into the extent of problems and allows corrective actions to be implemented in time to affect the future course of the program” [reference: NDIA, IPMD EIA-748 (Revision D) EVMS Intent Guide]. Unfortunately, variance analysis is an easy target for criticism during EVMS reviews. There are many examples of inadequate variance analysis to choose from, but what they all have in common is the lack of specific information on the “why, what, how, when, and who” of any variance. The variance analysis reporting requirements are found in the EIA-748 (Revision D) Guidelines in Section IV., Analysis and Management Reports, Guidelines 22-27.
| EIA-748 Guidelines Section IV. Analysis and Management Reports |
||
|---|---|---|
| 22 | 2-4a | Control Account Monthly Summary, Identification of CV and SV |
| 23* | 2-4b | Explain Significant Variances | Earned Value Management |
| 24 | 2-4c | Identify and Explain Indirect Cost Variances |
| 25 | 2-4d | Summarize Data Elements and Variances thru WBS/OBS for Management |
| 26* | 2-4e | Implement Management Actions as Result of EVM Analysis |
| 27* | 2-4f | Revise EAC Based on Performance Data; Calculate VAC |
A VAR that includes specific information and data about a problem will allow management to make informed decisions and mitigate project risk. Getting specific about variance analysis reporting includes the following elements.
Ask yourself, is the analyses presented in a manner that is understandable? Does the data support the narrative? Does the variance explanation provide specifics of:
“why” the problem occurred,
“what” is impacted now or in the future,
“how” the corrective action is being taken,
“when” the corrective actions will occur,
“when” the schedule variance will become zero, and/ or the work gets “back on schedule”
“who” is responsible for implementing the corrections?
Remember, a well-developed Variance Analysis Report can reduce the risk of a Corrective Action Request (CAR) during an EVMS review.
EVMS Variance Analysis — EVMS Analysis and Management Reports Read Post »
The lack of a useful, concise, easily understood top level plan for a project is an issue that our consultants have repeatedly noted. It is way past time for the adoption of more useful and understandable executive level schedules. Having a distinctive top level plan linked to the lower level Integrated Master Schedule (IMS) planning can help differentiate one approach or one project from another.
With the advent of modern scheduling software such as Microsoft Project or Primavera, we have been assisting clients in developing more and more complex Integrated Master Schedules. However, a bigger and more complex IMS does not make the project plan any more accessible or understandable. In fact, it makes having an attractive and useful top level schedule more important.
The Data Item Description (DID) that governs the IMS, the Integrated Program Management Report (IPMR) DI-MGMT-81861, requires a Summary Master Schedule and describes it as:
3.7.1.3.2 Summary Master Schedule. A top-level schedule of key tasks/activities and milestones at the summary level which can be sorted by either the Work Breakdown Structure (WBS) or IMP structure (if applicable). It shall be a vertically integrated roll up of the intermediate and detailed levels within the IMS.
The Planning & Scheduling Excellence Guide (PASEG) developed by the NDIA Program Management Systems Committee is a wonderful resource for schedulers. The guide discusses the Summary Master Schedule in a way that avoids specifying it is to be sorted either by WBS or by Integrated Master Plan (IMP) the way the data item description does. It also does not describe the top level as a roll up. The PASEG describes the Summary Master Schedule as:
Summary Master Schedule – The Summary Master Schedule is ideally a one (1)-page schedule and may also be called a Master Phasing Schedule (MPS), Master Plan or Summary Schedule. As the highest, least detailed schedule, the program’s summary master schedule highlights the contract period of performance, program milestones, and other significant, measurable program events and phases.
The Program Team initially develops the program summary master schedule from the analysis of requirements data during the pre-proposal phase and similar past program efforts. The program team review and approve the program’s top-level schedule, which serves as a starting point in the Top Down planning approach (See Top Down vs. Bottom up Planning). This process continues until contract award to include any changes caused by contract negotiations.
Key components of summary master schedules could include significant items from the following list:
The PASEG further describes the process for developing the Summary Schedule. H&A agrees that this process is the effective one for creating an executable plan. The process makes the top level summary schedule even more important. The process outlined by the PASEG is:
In addition to the Data Item Description and the PASEG, H&A suggests that the Summary Schedule have some specific attributes that make it useful. It should be:
Because the graphics in the IMS tools do not provide those attributes, H&A most often sees clients building some sort of “cartoon” plan, manually drawn in Excel or PowerPoint, and used during the proposal phase until the IMS can be considered solid enough to start using the roll up in the IMS as a Summary Schedule. The problem with this approach is that it is not linked electronically to the IMS; it is not part of the IMS and the data in the two can easily become different.
The maintenance of the cartoon version is continued in some cases or abandoned. When it is continued it involves labor effort to draw and redraw the plan based on changes and updates. Often the cartoon is abandoned and the roll up approach from the IMS tool takes over. At this point the top level executive type schedule no longer exists and the project plan is no longer readily accessible.
One of the main benefits of having an executive level summary schedule is that the program manager and team can easily tell the story of the project in a one page, coherent, easily understandable plan; and with the proposed methodology this summary schedule is linked to the IMS so the two do not become separated.
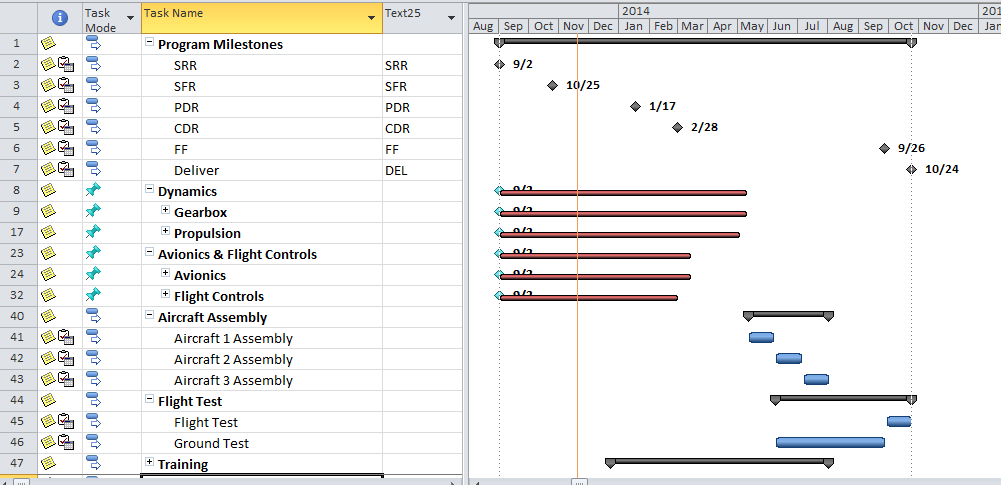
Looking at the two examples of a master schedule for the same project shown below, it is apparent that the first one is from Microsoft Project; it has the roll up look and feel to it. The summary bars do not really provide much information other than to indicate there is more information below.
The other example from the H&A methodology is a top level schedule that tells the story of the project in a form that flows the way the project does. It may be in WBS or OBS order but those may not be natural to the flow of the project. This example is grouped in the order that displays the evolution of the project the way the team thinks of the project. The tie to the underlying IMS is built into the plan. Each milestone or bar on the top level represents one or more tasks within the IMS so a user can find the identification of the corresponding work in the depths of the IMS when needed.
H&A now has developed a methodology supported by commercially available software that follows the guidance of the NDIA Planning & Scheduling Excellence Guide (PASEG) and provides the ease of use and executive level visibility needed in a top level schedule. Now a project can have a useful and demonstrative top level schedule that drives the top down planning effort as recommended in the PASEG.
This methodology was recently used successfully in the aerospace industry to develop the top level executive schedule view that drove the planning of a proposed multi-billion dollar project and to tell the story of the proposed project convincingly. The benefits perceived in that instance were:
To learn more about the H&A top level project road-map methodology and other EVMS topics, visit our website or call us to discuss your project.
![]()