One of the Earned Value Management (EVM) topics that always initiates lively debate is the planning of Scrap, Rework, and Repair (SRR). These debates often become very emotional. So, what makes the topic of planning SRR so emotional? There are two primary factors. First, you are planning for something that is not in alignment with a success oriented plan. In an ideal project there would be no Scrap, Rework, or Repair. Second, we do not know what parts will require SRR or when it will occur. Let’s start with baselining some definitions:
- Scrap – Manufactured articles or parts that are rejected or discarded. Waste that either has no economic value or only the value of its basic material content. Examples include a part that was made too small or a part that was damaged and could not be repaired.
- Rework – The process of bringing a non-conforming part back into conformance by re-performing a previous process step. An example would be a part with a hole that was drilled undersize that could be re-drilled to the correct size.
- Repair – The process of bringing a non-conforming part back into conformance by using a process outside the original process. An example would be a part that was painted and the undersized hole was not discovered until after it was painted. The repair now requires additional process steps, of stripping and re-preparing the material, that were not part of the original process. (Note: for this discussion we will focus on inline repairs. Repairs that arise post acceptance are not included in this discussion.)
Along with these basic definitions, we need to understand how your company defines and handles these costs. Some companies treat these costs as indirect and some treat them as direct costs. When these costs are classified as indirect costs, the company establishes material overhead pool(s) that collect the costs for allocation across the direct material dollars. These pools might be segregated by material type and have different allocation bases. A company’s CASB Disclosure Statement will define the pools and bases. Some companies treat these as direct charge items and will have procedures for the treatment of SRR and non-conforming material costs. RULE 1 – The budgeting of SRR must be consistent with the way costs are collected and charged. Because of the vagueness of knowing what parts will require SRR and when it will occur, the indirect costing approach is the most straight forward method within an Earned Value Management System (EVMS).
Next we need to understand how your company’s shop floor works and how non-conforming material is handled. Most shop floors work with shop orders that are issued to direct how parts are processed and routed through the process. As a part is processed into a higher level part or subassembly the costs are usually collected at that next level part/subassembly. In this way each part’s cost can be established by summarizing all the lower level parts and routing steps. In an EVMS, these shop orders are usually grouped into work packages. Usually the shop floor has procedures in place to identify the cause and corrective action associated with an issue when a part is identified as non-conforming. The corrective action approach will define what will have to be done to resolve the issue. The corrective action can be anything: scrapping and starting over from an earlier process step with an updated procedure, re-procuring, repairing, or reworking. In any corrective action approach, new procurement request(s) and/or shop order(s) will be issued with new direction. The costs are then collected and handled based on how your company has defined the process. Most companies have an additional requirement to segregate these costs to support their Cost of Quality program/system. (We could dive deeper into the processes for each scenario, but that is not the focus of this blog.)
Now that we have some basic understanding of what SRR is, how it is handled on the shop floor, and how it is costed, we can look at how to budget it in an EVM environment. Remember, we do not know what parts will need SRR, and for those that will need SRR, we do not know when it will be needed.
Let’s take the indirect costing approach first. The budget for SRR is established by the overhead factor being applied to the base cost. The value of the overhead rate is determined based on the annual planning process. As a dollar of the base material pool is planned, the SRR rate is applied. An owner is established for each pool that will also be the source for future variance analyses and forecasts.
For the direct costing approach there are several options. The following are the most common planning and budgeting options used:
- Control Accounts with Planning Packages
- Summary Level Planning Packages
- Management Reserve
- Unplanned SRR
The first 3 options have an amount of SRR that has been identified either as a factor based on historic data or as part of the Risk Management process. This SRR is usually identified to an assembly, sub-assembly, or part. The fourth option addresses an SRR event that was not planned in the baseline.
The first option is to include SRR in the Scope of Work for the production Control Account(s). The CAM then establishes one or more planning packages for SRR. The planning package(s) are associated with a grouping of parts and/or timing for effort in the future beyond the detailed planning horizon. As SRR is identified, the planning package is detailed planned (partially or in its entirety) into a work package. The procurement directions and/or shop orders that make up the non-conforming corrective action are grouped to make up the work package. In this approach it is possible that the conversion from planning packages to work packages will occur in the current accounting period; note that this approach might be in violation of a company’s defined freeze period procedure. When there is enough insight into the items identified as possible SRR candidates, including the timing of the SRR, a budget will be pulled from the planning package into a work package as part of the normal rolling wave planning cycle. The goal always should be to plan the effort into work packages as early as enough information is available. In this scenario the CAM will assess performance, perform variance analyses, and provide forecasts.
The second option is to budget a Summary Level Planning Package (SLPP) at a WBS level higher than the Control Accounts. This approach is used when SRR is planned for a WBS element but the specific Control Account cannot be identified. This budgeting approach works similar to converting from planning packages to work packages, but there are additional steps to authorize and issue scope and budget from the SLPP to the CA. The Program Manager, Integrated Product Team Lead, or WBS Element Manager will provide forecasts for the SLPP as part of the EAC process.
The third option is for the Program Manager to hold the budget for SRR in Management Reserve (MR). As SRR is identified, the CAM will request MR using the normal change control process. The PM will address the MR when analyzing the program’s overall performance.
The fourth option addresses how to handle unplanned SRR. Often these approaches of creating new Work Packages and making Earned Value adjustments may “violate one or more EVMS rules” but pass the cost/benefit common sense rule. In this option the new procurement direction and/or shop orders are added to the existing work package grouping. There is no new budget allocated and the additional actual costs that are collected are explained as a variance. If that work package had been closed it will need to be re-opened. If cumulative BCWP is now overstated, it may need to be adjusted (de-earned) to reflect that work is still remaining. The ETC/EAC is also updated to reflect the estimated timing and cost for the SRR. If you select this approach, make sure your system description and procedures allow for these exceptions to generally accepted rules. This approach may drive numerous anomalies in the EVM data, which will need to be explained in Format 5 of the Contract Performance Report or Integrated Program Management Report.
If the SRR is a large amount of work and will take a significant amount of time, it might warrant establishing an Over Target Baseline/Schedule (OTB/OTS). If this is the case, be sure to discuss the approach with your customer.
Additional Cautionary Tales and Lessons Learned:
Cost versus Benefit – Make sure that your manufacturing system can support what is described in your EVM System Description. Also, understand the cost impact for the process benefits that you are designing. Sometimes the benefit does not justify the cost.
Understand how your manufacturing and accounting systems handle scrap, rework, and repair. These are the source systems that will drive how you handle SRR for Earned Value Management.
Material and Labor Cost in the Same Work Packages – If the part that requires repair or rework was a buy item, it was budgeted as material. The repair or rework may appear as labor. Some systems restrict the comingling of production material and labor in the same work packages. In the case of SRR that restriction should not apply.
Purchasing Clauses – Ensure that SRR and the associated costs are adequately addressed in purchasing clauses for buy parts. Also, make sure you understand how major subcontractors with an EVMS flowdown requirement handle SRR in their systems.
Fast Tracking increases the risk of SRR – Starting Low Rate Initial Production prior to completing the design and development effort will lead to starting production with a dynamic technical data package. This increase in risk will also increase the amount of SRR that can be expected on a project.
SRR outside the shop floor – There are similar issues that need to be addressed when performing Software, Integration, Spares, Tooling, and Testing efforts.
Make sure your system description reflects how you handle the budgeting, earning, estimating, and costing of SRR.
We only addressed the topic of BUDGETING Scrap, Rework, and Repair at a summary level in this blog. The devil is always in the details. We recommend that you test your approach in your systems prior to implementing to ensure your tools operate as you expect. If your EVMS is validated through the DCMA, or other validating/certifying agencies, you should seek their approval of your procedures prior to implementation. Also, the Integrated Master Schedule (IMS) process and Risk/Opportunity Management System need to address SRR.
 Recently one of our consultants was instructing a session on the Integrated Master Schedule (IMS) with a group of project personnel from one of our larger clients. The group was a mixture of beginners with no real experience in schedules and some much more experienced practitioners; some with more than 10 years of experience. The mixture made it somewhat difficult, but it also made for some interesting discussions that might have been missed in a more homogenous group. One of those things was the usefulness or importance of the “time-now” line.
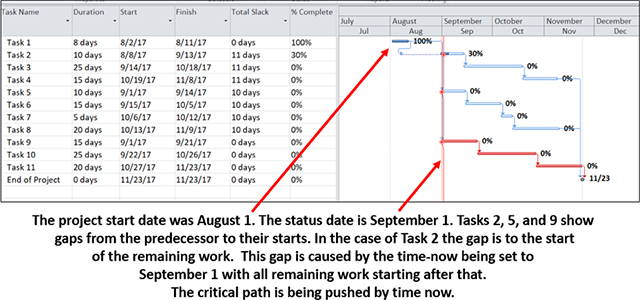 Figure 1
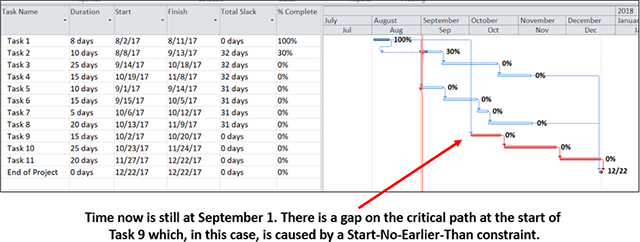 Figure 2
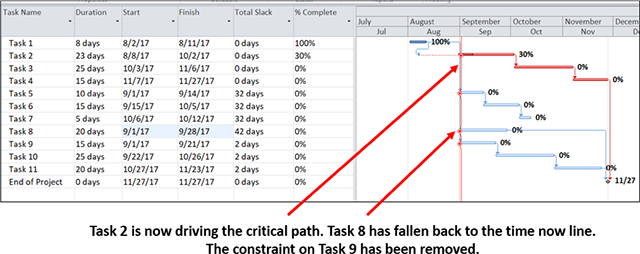 Figure 3