Effective Use of Quantifiable Backup Data (QBD)
")
One of the fundamental rules that contributes to generating useful information from an Earned Value Management System (EVMS) is planning the work in manageable segments to facilitate more accurate project performance status. The goal in selecting an appropriate earned value technique (EVT) for a work package or task is to use the most objective rationale possible for the nature of the work. This often becomes more challenging when the Percent Complete EVT is selected for a longer duration work package/task. That’s where the use of Quantifiable Backup Data (QBD) comes into play. Properly used, QBDs provide the necessary objective evidence to claim earned value.
QBDs are also sometimes referred to as “predetermined rationale” consisting of defined lower-level objective and measurable milestones or steps that when completed contribute to the overall work package/task percent complete. The work package/task percent complete is determined based on when the milestones or steps are accomplished and the weight, typically a percentage of the total budget, assigned to the milestones/steps.
What are the benefits of using QBDs?
QBDs help to ensure there is a clear definition of done for each milestone or step; earned value claimed is based on verifiable accomplishments. Project personnel can substantiate and communicate to other project stakeholders how they determined the current overall percent complete for a work package/task based on documented criteria. QBDs eliminate the subjectivity often associated with using the Percent Complete EVT.
Common Characteristics of Effective QBDs
Here is a short list of the expected characteristics of QBDs.
- Specific, defined accomplishment criteria are established before work begins. The accomplishment criteria must clearly describe the objective measurable outcome or deliverable.
- Documented and actively maintained. QBD details could be captured in a specific tool, database, or as additional attributes of the EVM data. Designated project personnel are responsible for “owning” and maintaining the QBD details; this is typically the control account manager (CAM). The QBD details should be accessible to all project stakeholders to review as needed for full transparency. There is a defined, repeatable process to track any scope changes to the QBD accomplishment criteria.
- Used as the basis for performance measurement. As work progresses, the QBD owner tracks the milestones/steps and records when the accomplishment criteria are met. The QBD weight provides the objective basis to determine the current cumulative to date percent complete used to calculate the work package earned value.
- They may or may not have a period of performance depending upon the nature of the work effort and QBDs. QBDs with a period of performance align with the scheduled time frame for the work package/task they support; this should be captured with the QBD details. When the QBDs are used solely to calculate task progress, they do not have a defined period of performance. They may be accomplished in any order.
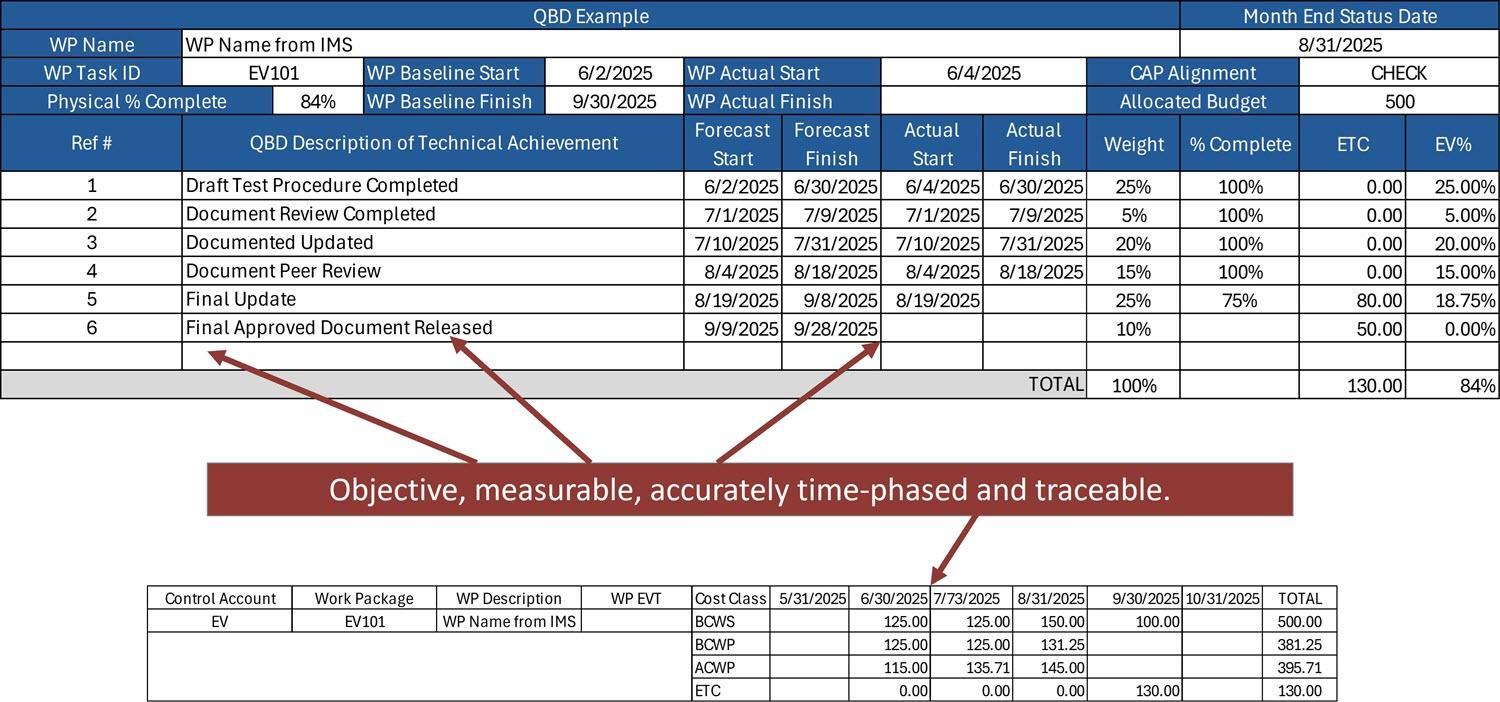
Figure 1 provides an illustration of the use of QBDs with a period of performance.
What are common QBD issues?
H&A earned value consultants routinely provide hands-on support and guidance to our clients when there are issues with an EVMS implementation. Here is a short list of issues with the use of QBDs that they have observed on various engagements.
- Generic QBDs that are not measurable and lack exit criteria. An example of generic QBD descriptions: Test Procedure Development Step 1, Test Procedure Development Step 2, and Test Procedure Development Step 3. Since there is no clear definition of what the steps entail, generic QBDs are subject to interpretation and not useful.
- Ad-hoc methods to capture accomplishment/exit criteria. The QBD must be documented in a manner that others on a project can access and verify.
- Weighting is not well defined or tied logically to the technical work. If the basis used to determine or substantiate the weighting is not known, the QBD is lacking an objective means to determine whether that weighting makes sense.
- The time-phased cost values are not logically tied to the weighting. Classic case of failing to ensure the BCWS, BCWP, and ACWP are aligned in a given reporting period for accurate performance reporting. Figure 1 illustrates this requirement for data traceability between the QBDs and the time-phased cost data. It is easy to verify that the BCWS and BCWP for June (125.00) aligns with QBD #1 weight of 25% of the total budget (500).
- Disguising level of effort (LOE) as discrete work effort with QBDs. Evidence of this: QBD weighting or time-phasing is level loaded.
Strategies for Ensuring the Effective Use of QBDs
All of these issues can be prevented with a focus on data quality and ensuring project personnel have the necessary tools and training. Here are a few successful strategies H&A earned value consultants have helped our clients to implement to ensure the effective use of QBDs.
- Review your EVM System Description and any related procedures specific to QBD content. Has a repeatable process been defined that describes the expectations and requirements for the use of the QBDs for the entire project life-cycle? Establishing the QBD accomplishment/exit criteria details is an essential part of the project planning activities at the beginning of the project. Is there clear direction on when the use of QBDs are appropriate? A common example is when a supporting process such as Agile is providing the QBD information to claim earned value in the EVMS.
- In support of the repeatable process, establish a common software tool or core EVM tool configuration that includes a means to capture the required QBD details. As part of the design criteria, be sure to allow for project specific configuration options in addition to the standard core data requirements. The objective is to make it easy for project personnel to capture the necessary data and reduce the likelihood of ad-hoc methods.
- When it makes sense, create a QBD “library” of common, repeatable milestones/steps that include a crisp description, measurable outcome or deliverable, and rationale for the weighting that project personnel can use as a basis for their work packages/tasks. This works best when there is historical data to substantiate the total budget, duration, elements of cost, and weighting. A complexity factor may also be applied that is documented.
- Conduct targeted training on how to properly document and maintain the QBD details following the documented process and using the tools of choice. Hands-on exercises and examples can help project personnel learn how to distill requirements into clear specific accomplishment/exit criteria and how that process saves time throughout the project execution phase. For example, it is easier to quickly track QBD progress. The basis for claiming earned value is transparent and auditable.
- Include a review of the QBD details as part of any Integrated Baseline Review (IBR) to ensure clear accomplishment/exit criteria have been defined as well as to ensure they have been properly used. This helps to eliminate a number of QBD issues at the beginning of project including instances where LOE is disguised as discrete work effort.
Need help with your QBD planning and implementation?
H&A earned value consultants often assist clients with producing work or desktop instructions that help project personnel to address common issues with implementing an EVMS on their projects such as the proper and effective use of QBDs. H&A schedule, cost, and other toolset experts can help you to establish a core, common configuration to capture QBD details or collect supporting data from other software tools. Targeted and tailored training is one our core competencies – we can help you to enhance your training content to include QBD best practice content and exercises. We also routinely conduct mock IBRs for our clients to ensure they are well-prepared for the event with their customer. Call us today to get started.
Effective Use of Quantifiable Backup Data (QBD) Read Post »


 example #1")
 example #2")
 example #3")
 example #4")
 example #5")
 example #6")
 example #6 details")