Estimate to complete

What is the Difference Between Budget and Funds?

, , , , , , ,

Quick Summary

  • A budget is a project management metric used to plan and measure performance, while funds are real dollars recorded in the accounting system and spent to perform the work.
  • Earned Value Management distinguishes planned values (e.g., BCWS, BCWP, BAC) from actual costs and estimates (e.g., ACWP, ETC, EAC) to provide insight into project performance and funding needs.
  • Contract funding profiles influence how budgets are time-phased, and regular EAC analysis is essential to forecast total funding requirements and avoid breaching funding limits. 

While working with numerous clients over the years, H&A earned value consultants frequently observe people using the term “money.” Typically, they mean “funds” when they really mean “budget.” People often confuse the terms, even though they have been used within the project management community long before the advent of earned value management practices. 

The intention of this blog is to highlight the difference between “budget” and “funds” and promote a common understanding of the terms. Using the correct term helps to eliminate confusion and improve communication between project team members, management, and the customer. 

Examples of Budget and Funds Confusion

Here are a couple of common statements H&A earned value consultants have heard many times:

  • I am requesting management reserve (MR) to fund my overrun.
  • I underran my budget, so I am going to return funds to MR.

Why are these inaccurate statements? The people making them have confused the terms or may think that “budget” and “funds” mean the same thing. 

Explaining the Difference Between Budget and Funds

The simple definition is that “budget” is a project management metric, a planned value. It cannot be used as funds (i.e., money) to buy something tangible, such as a cup of coffee. “Funds” are real dollars. The purpose for budget is to measure project performance so that as funds are expended (the actual costs) to perform the authorized work, any difference, more or less than what was planned, can alert management.

The table below summarizes the differences between the two terms.

BudgetFunds
Cannot be spentMoney – real dollars being spent or forecasted to be spent. Funding represents the customer’s ability and commitment to pay. 
A number on a piece of paper, in a spreadsheet or database – it is a project management metricActual costs recorded in the accounting system of record used for financial reporting
Budgeted Cost for Work Scheduled (BCWS)
  • Time phased budget for required resources to accomplish tasks scheduled in the integrated master schedule (IMS)
  • Forms the performance measurement baseline(PMB)
Estimate to Complete (ETC)
  • Funding required to complete the remaining work, exclusive of prime contractor fee
  • ETC plus ACWP results in the Estimate at Completion (EAC)
Budgeted Cost for Work Performed (BCWP)
  • The budget value for completed work
Actual Cost of Work Performed (ACWP)
  • The costs incurred and recorded to accomplish the work performed
Budget at Completion (BAC)
  • Budget representing all authorized scope of work (SOW)
  • Cannot change without a change to the SOW with appropriate approval
Estimate at Completion (EAC)
  • Funding number representing all the money (at the cost level – does not include fee) that will be spent
  • Can change without a commensurate change in the SOW

An Overview of Budget Terms

It is often helpful to review the basis for determining and distributing a project’s total budget used for planning and measuring project performance, as illustrated in Figure 1. Note: this is a simplified discussion to highlight the budget terms and does not include nuances such as an Over Target Baseline (OTB) situation. 

Figure 1: Budget Distribution and Terms Illustrated

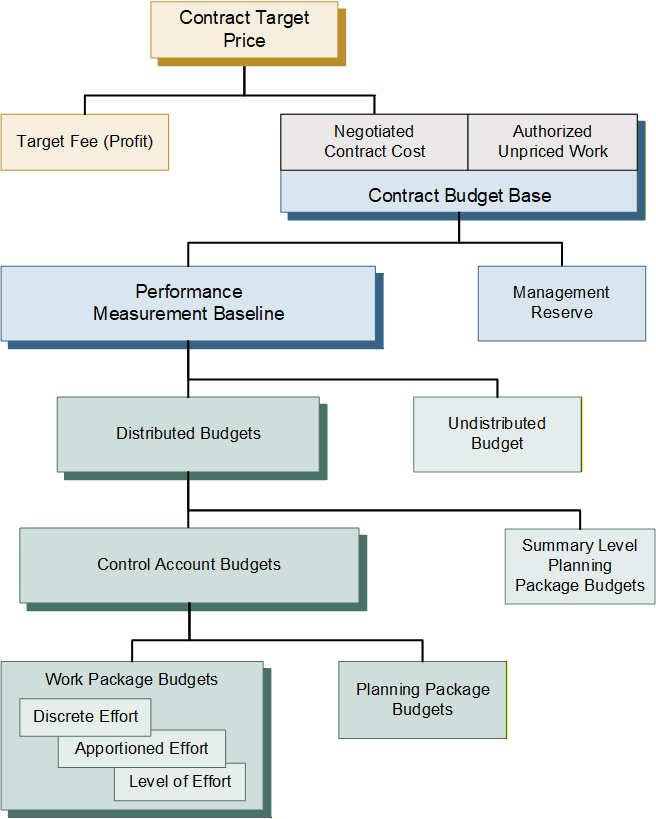
The budgeting process begins with the Contract Target Price (CTP). This is the total negotiated contract value. It includes the negotiated contract cost (NCC) plus the contractor’s planned (target) profit or fee. The Contract Budget Base (CBB) is the starting point for a contractor’s internal budgeting process outlined below. 

Budget ComponentDefinition
Contract Budget Base (CBB)  Represents the financial authorization of the contract and is based on the negotiated contract cost (i.e., price less fee). The CBB is always equal to the negotiated cost for definitized work and the estimated cost for all authorized unpriced work (AUW), also known as Undefinitized Contact Action (UCA). The CBB equals the sum of distributed budgets, undistributed budget, and management reserve (MR). It also equals the sum of the performance measurement baseline (PMB) and MR.
Management Reserve (MR)  Amount of contract budget set aside to handle realized risks and emerging in-scope effort. This effort is in scope to the contract, but out of the scope of distributed and undistributed budget. 
Performance Measurement Baseline (PMB) The PMB is the sum of all distributed direct and indirect budgets against which contract performance is measured. The PMB is the sum of the distributed budgets and undistributed budget. The PMB plus MR is equal to the CBB. 
Undistributed Budget (UB) Budget for authorized work scope that has not yet been identified to a specific WBS element and/or responsible organization at or below the lowest level of reporting to the customer. 
Distributed Budgets  Distributed budgets may be comprised of summary level planning package (SLPP) and control account budgets.
Summary Level Planning Package (SLPP) Budgets Budget may be set aside in SLPPs at the lowest WBS element until the future work effort can be defined in more detail. SLPPs have a high-level scope of work and are scheduled in the IMS with time-phased budgets. They are converted to one or more control accounts with subordinate work packages and planning packages as soon as possible. 
Control Account Budgets  Control accounts have a defined scope of work, scheduled start and finish dates, and time-phased budget that reflects the work decomposed to the work package or planning package level. The sum of the time-phased work package and planning package budgets equals the total control account budget. 
Work Package/Planning Package Budgets  Work packages and planning packages have a defined scope of work, scheduled start and finish date, and time-phased budget based on the parent control account. This lowest level of budget includes the element of cost detail (labor, material, subcontract, and other direct costs) and value detail (hours, units/quantities, direct costs, and indirect costs). 

Notes about Management Reserve

Remember that MR is a budget, is not a financial reserve (i.e., a source of funds). It is not time-phased and is not included in the PMB because there is no related work scope, although it is a part of the CBB. MR budget cannot be used to eliminate cost variances, cover cost overruns, or recover underruns. There is only one MR set aside for a project and the value is never negative.

MR is decreased to provide budget for realized risks or unplanned activities within the contract scope of work. It may be increased whenever the work scope is decreased along with the allocated budget (a contract modification). Customer authorized contract changes, including AUW, should be incorporated into the CBB and PMB as soon as possible; this may include MR budget set aside for added work scope. Only contract changes authorized by the customer’s designated contracting officer may change the CBB value. 

For more discussion on MR, see this blog: Management Reserve Best Practice Tips. Also see this article: The Difference Between Undistributed Budget and Management Reserve

Additional note. The MR budget belongs to the contractor’s program manager, not the government customer. MR is not a cost reserve (contingency) for the government customer and may neither be eliminated from contract prices by the customer during subsequent negotiations nor used to absorb the cost of contract changes. For the government customer, contingency is the cost reserve they own, typically associated with a Program Risk-Adjusted Budget (PRB). It is held outside of the project scope, schedule, and budget already provided to the contractor. Reserves held above the program permit senior government management to balance resources within portfolios and among programs. The government customer’s cost reserve could be used to modify the contract to include additional work scope (increases the contractor’s CBB) or provide the funds needed to cover a contract cost overrun. 

Budget, Estimates, and Funding Profiles

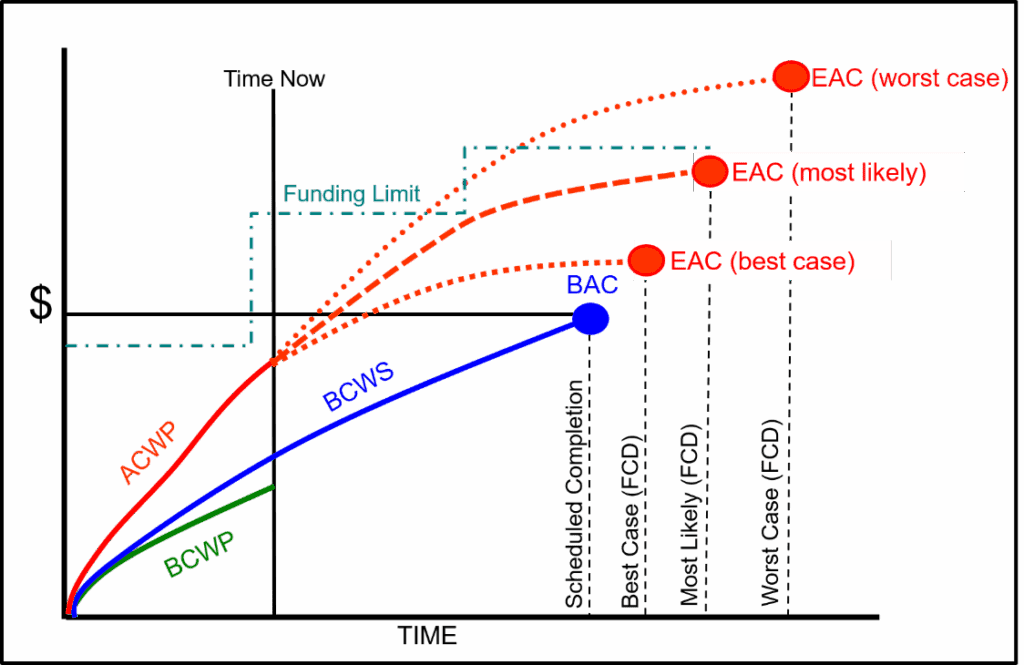
Contract funding also influences how the PMB budget is allocated and time-phased. The budget distributions are a result of the project planning process (scope of work definition, detailed schedule development, initial cost estimates), MR set aside (risk and opportunity planning), and the funding profile. This is an iterative process to develop the baseline schedule and time-phased budget plan. The budget distributed to the control accounts and any SLPPs is compared to the total PMB/UB value. As needed, adjustments to activities, sequence of work, or resource assignments are made to ensure the overall budget plan reflects the budget limit for the PMB and the contract’s funding profile. For a real-world example of this, see this blog, Understanding the ALAP Scheduling Option in Practical Terms, where a front-loaded schedule was exceeding the funding cap, and how a H&A scheduling consultant helped resolve the issue.  

Preparing an EAC every reporting cycle provides an accurate projection of cost at contract completion for internal and external management. It also represents the estimate of total funds required for the contract. The most likely EAC should be within the funding constraints for the contract. Any amounts expended in excess of the contract funding limit puts the contractor at risk. The contractor must notify the customer when their EAC analysis determines there is a potential to breach a funding constraint to address any contract funding issues as quickly as possible. 

Figure 2 illustrates a funding profile along with the range of project EACs. In this figure, the most likely EAC is within the contract funding limit.

Figure 2: Management Level EACs with Funding Profile

Reinforcing a Commitment to EVMS Excellence

A common theme of the H&A blogs and articles is helping clients to achieve and maintain a commitment to a high level of excellence in all EVMS process areas. An important part of this is continuous EVM training and project scheduling training, whether for beginners or advanced practitioners. This includes targeted training when clients identify an area where project personnel could use a refresher, more hands-on training, or mentoring. Examples include basic and advanced EVMS workshops, Completing Variance Analysis Reports, Developing an ETC and EAC, as well as short, targeted courses on topics such as Budget versus Funds. Give us a call today at (714) 685-1730 to get started.

What is the Difference Between Budget and Funds? Read Post »

Earned Value: Fun with Numbers or Real Management Data?

, , , , , , , , , , , , , , , ,

HA_Blog-Earned Value

What Are Earned Value Basics?

We used a quick quiz with some helpful links to give you an opportunity to test your basic understanding of an EVM graph from a real EVMS Program.  We go into detail about each concept displayed in the graph and our overall analysis of the project based shown in the graph.

Earned Value: Fun with Numbers or Real Management Data? Part 1

In Part 1 we reviewed where you could find more information about EVM Implementation and Basic Concepts of Earned Value on our site.  We also included a review quiz.

  1. EVM Implementations
  2. EVM Graph Quiz Testing Basic Earned Value Terms

Earned Value: Fun with Numbers or Real Management Data – Answers (part 2)

In Part 2 we provided the answers to the EVM Quiz and provided detailed definitions and descriptions for each of the quiz terms.

  1. EVM Quiz Answers
  2. Management Reserve
  3. Schedule Variance
  4. Budget At Completion
  5. Contract Budget Base/Contract Target Cost
  6. Budgeted Cost for Work Scheduled
  7. Schedule Slip
  8. Variance At Completion
  9. Estimate At Completion
  10. Actual Cost of Work Performed
  11. Estimate To Complete
  12. Cost Variance
  13. Program Overrun
  14. Time Now
  15. Budgeted Cost for Work Performed
  16. Forecasted Program Schedule Slip
  17. Estimated Completion Date
  18. Discussion of the displayed data


Earned Value: Fun with Numbers or Real Management Data? Read Post »

Agile/Scrum Ceremonies and Metrics Useful in EVMS Variance Analysis and Corrective Action

, , , , , , , , , , , , , , , , , , , , , , , , , ,
Agile Scrum EVMS

P. Bolinger, CSM October 2016
Humphreys & Associates

How can Agile/ Scrum be used to support EVMS Variance Analysis and Forecasting in a way that provides program managers with cost and schedule integrated information for no extra effort?

The discipline of EVMS and the Agile/Scrum practices have several touch-points that are covered in two major documents: NDIA IPMD Agile Guide March 2016, and PARCA Agile and EVM PM Desk Guide. Neither of these documents, as yet, drives to the level of specifics when it comes to best practices for use of Agile to support EVM Variance Analysis and EVM Forecasting.

Looking at the literature for Agile/Scrum, we know that there are recommended ceremonies that are conducted at various levels of the product structure and at different times during the project life cycle. These ceremonies are supported by many discussions of the metrics that can be collected at each ceremony and their potential use in managing the technical work of development within the Agile/Scrum framework. But where do these ceremonies potentially support EVMS Variance Analysis and Forecasting?

Now suppose we are presented with a control account that has exceeded the EVMS thresholds for cumulative cost and schedule variances. Wouldn’t it be great to have at our fingertips the underlying data from the process? In this case we might find, for example, that the Velocity is less than that needed to meet the end goal, the story cycle time is longer than desired, the pass/fail ratio is not favorable, too many team members have been absent in the last Sprint, the number of disruptions has been excessive, and the work to accomplish the stories is higher than estimated. It is not difficult to surmise the outcome would likely be a behind schedule and overrun condition in the EVMS. These data measures would provide the fodder for deep diving to the root cause and impact statements.

Where would we get that information?

Let’s start with the Agile/Scrum ceremonies. The particular Agile/Scrum ceremonies that we find conducted during the project are:

Backlog Refinement. This ceremony can be nearly continuous. It involves redefining the backlog of development work (scope), the prioritization or re-prioritization of that work, and potentially the assignment of responsibilities for the backlog.

Release Planning. This is a recurring ceremony aligned with the release cadence for the project. It involves establishing the capabilities and features of the product and when they will be released.

Sprint. This is a short time-defined effort to accomplish the design, code, and test of some subset of the product. The Sprints are controlled by the self-managing teams.

Daily Scrum or Standup. This is a daily (recommended) team meeting to discuss what has happened, what roadblocks exist, what is planned for the day, and other necessary items.

Sprint Review. The session in which the team products are demonstrated to the owner and self-off is accomplished.

Sprint Retrospective. A meeting of the stakeholders to discuss what went right (or wrong) during the Sprint and to define improvement actions that are needed.

The relationship of these Agile ceremonies with EVMS might look like this:

Agile/Scrum Ceremony

Agile Purpose

Relationship to EVM Variance Analysis, Root Cause Analysis, Corrective Action Planning & Follow-up and Forecasting


Backlog Refinement Manage, estimate, prioritize, and organize the product backlog in an on-going routine. Estimating – impacts the EVMS ETC and EAC as well as durations of efforts.
    Prioritizing – in response to issues is corrective action management.
    Organizing the backlog could be a form of corrective action effort.
     
Release Planning Establishing the contents and timing for releases of product. Updates could be part of corrective action planning in response to issues. Creation of new work packages. Changes to planning packages and SLPPs would also.
     
Sprint Short time-box performance unit. Work is done in Sprints. Below the work package. Short span measurement period is possible.
     
Daily Scrum and Stand-up Make short term plan, adjust to issues, discuss problems, clear roadblocks. Much of the daily action would relate to root cause analysis and corrective action planning although the time-frame is very short and the issues may be too small to individually impact feature work package or the Epic control account.
     
Sprint Review Demonstrate the product, update released work, make changes to product. This would relate to corrective action planning and follow-up. Issues would be found here that would impact risks, ETCs, corrective actions, performance metrics.
     
Sprint Retrospective Reflect on the project, progress, people processes, what was good, what was bad, and take actions to improve. This should be the richest source of supporting information for EVMS root cause & corrective action within the VAR realm. Very timely for variance analysis as it happens potentially many times during work package (feature) duration.
Feature Retrospective (not one of the basic ceremonies) Review situation regarding technical scope deficit. Reflect on the project, progress, people processes, what was good, what was bad, and take actions to improve. Because this only happens at the end of the feature it is limited in value for variance analysis timeliness. Any lessons learned can only be applied to future feature work.

But where is the meat? Where do we get actionable data or at least data we can analyze to decide what management efforts are required?

There are numerous potential metrics that can be collected during these ceremonies. These metrics can form the basic data set that could be analyzed to define the root cause of cost and schedule variances. In addition to isolating the cause of issues, within some of these ceremonies the impact of the issue on the Sprint, or Feature, or team may be made. Certainly, these metrics can be used as the basis for projecting future workload and performance.

The total number of potential metrics is not known. In this paper, we looked at 17 metrics and considered what the data might mean. The results of this review are contained in this matrix:

Metric

Type of Measure

Discussion

Sprint Burn up/Burn Down Backlog Value of backlog remaining for Sprint. Decrease is expected when work is done. Increase means work increased. Burn up can include total completed plus remaining; a great metric.
Feature Burn Up/Burn Down Backlog Value of backlog remaining for Feature. Decrease is expected when work is done. Increase means work increased or shifted.
Customer support requests received. Disruption Number of instances. Unplanned interruptions by customer can lower the output of the team if excessive.
Disruption measures Disruption How many and what type (except customer support requests). Higher disruptions impact team efficiency.
Estimate Accuracy (Sprint or Feature) Estimating Measure of budgeted value (estimated value) for the Stories in the Sprint or Feature versus the actual cost (calculated cost) of the Stories when done. Related to team size.
Discovered work Estimating Emerging work discovered during the Sprint. Will translate to extra effort in future if adopted into backlog.
Exceeds WIP Limits Management If WIP limits are set on team or individuals then exceeding set limits will impact efficiency and output.
Retrospective Action Log Management Count of improvement actions listed in Retrospective. Increasing count means issues are not being resolved.
Attendance Management Comparison of actual hours worked by team compared to baseline expectations in plan.
WIP Productivity Measure of the number of stories or points in WIP at any time. WIP growth can indicate bottlenecks and inefficiencies.
Velocity Productivity Measure of the amount of work (Stories or Points) accomplished during a time period. Higher velocity means greater throughput per person/team.
Stability measures Productivity Comparing Sprint by Sprint basic measures from this list. If there is high variability between Sprints in measures, then future is unpredictable.
% Tests Automated Productivity Higher automated testing should increase efficiency & decrease cycle time.
Defects found by team Quality Number of bugs reported during team effort. Measures quality of work. Higher bug incidence translates to lower output and higher costs.
Defects found by customer Quality Number of bugs reported by user/customer. Measures quality of work delivered. Higher bug incidence translates to lower customer satisfaction and higher rework costs.
Pass/Fail (Re-do) measures Quality How does the rate of success in testing compare to the number of attempts? High success rate should mean greater output and efficiency.
Cycle Time Schedule Time from start of a story to complete. Short cycle time is desired.

Let us continue the theme of the behind schedule and overrun control account and look at what information would be available for support to developing the estimate-to-complete. An updated and refined backlog would have the scope of work remaining for the control account. The updated release plan would have the timing for the deliveries to be made in the control account. The metrics collected about the effort expended per accomplished story or story point would provide a factor for projecting future real-work hours. Planned corrective actions and improvements would tell us how we might expect improvement to the quality and improvement in the speed or cost of work. The insights available from a full set of metrics are impressive.

Does a project have to collect all of these metrics? If not all then which ones would be the right ones? Questions like that would be answered by the project management team analyzing their prior experience and the particular challenges of the project. The team would establish a data collection plan, likely described in their Software Development Plan or Program Management Plan that would explain the metrics, meaning, and frequency along with their purpose. With a clear understanding of the technical data to be collected and analyzed, the Control Account Managers would not have a difficult task to define how they would use that data in developing Variance Analyses and generating well-considered Forecasts. In fact, these tasks should be much simpler with the data in hand.

Agile/Scrum Ceremonies and Metrics Useful in EVMS Variance Analysis and Corrective Action Read Post »

Scroll to Top