EVM

Incorporating IMS Information Directly into Independent Estimate at Completion (IEAC) Formulas

, , , ,
Incorporating IMS Information Directly into Independent Estimate at Completion (IEAC) Formulas

“When you need to discuss the schedule, look at the schedule.”

– A Scheduler’s Lament

There are many existing formulas for calculating an Independent Estimate at Complete (IEAC) from earned value data. A recent study of a sample of projects found that the calculated IEACs analyzed at the 25%, 50%, and 75% complete points were not accurate when compared to the final actual cost of work performed (ACWP). The following table lists the thresholds used to assess the accuracy of the IEACs at the different complete points for the sample projects.

Percent CompleteAccuracy Threshold
25%Within +/- 10% of final ACWP
50%Within +/- 7% of final ACWP
75%Within +/- 5% of final ACWP

While working on that study of the accuracy of commonly applied IEAC formulas as well as on a small project as an analyst for a customer, the idea for using data directly from the integrated master schedule (IMS) in conjunction with the cost performance data to create a new IEAC formula emerged.

Using Data Directly from the IMS to Calculate an IEAC

It should be noted that none of the generally used IEAC formulas use data directly from the IMS. The IEAC formulas use data found in the cost performance portion of the earned value monthly reports to customers.

IMS data is only used indirectly in the IEAC formulas. When a task is started and progress updated, the earned value (the budgeted cost for work performed or BCWP) is developed from the progress reported. This is measured against the cost baseline (the budgeted cost for work scheduled or BCWS).

At the same time, in the IMS environment, the schedule analysts are calculating the Baseline Execution Index (BEI) for task completions/finishes. BEI (for finishes) measures how many of the tasks baselined to be completed by the cut-off date were completed. If all the tasks were done (BEI = 1), their value would have been earned. Of course, other tasks could have started, progressed, and maybe even finished. For this example, the Schedule Performance Index (SPI) calculated at that point (BCWP/BCWS) should be at least 1 and potentially higher. The SPI reflects the baseline value of completed tasks plus the in-process claimed baseline value. The in-process claimed value can be subjective in some cases.

The argument, if there were one, might be there is no need to try and include BEI or similar schedule measures in the IEAC formulas since they already include SPI.

However, there is a whole different and unique set of information coming from the IMS that is not currently used in the IEAC formulas. That information is what we chose to call “Duration Performance” and “Realism Ratio.” These are measures of the actual duration for completed tasks and the forecast duration for future tasks.

Calculating Duration Performance

The IMS data includes the baseline number of days assigned to each task as well as the actual number of days to complete each task. If a task is baselined to take 10 days (Baseline Duration = 10) and the task took 15 days to complete (Actual Duration = 15) then it is taking 150% of baseline to do the work.

This is similar to the Cost Performance Index (CPI) that uses the BCWP and the ACWP to determine how efficient the work performance has been. The formula BCWP/ACWP shows how the work accomplished compares to the cost of that work performed.

If we assume, for labor at least, that taking longer to complete a task often leads to costing more than baselined, we can use the Duration Performance to develop an IEAC.

To develop the Duration Performance, we would use the IMS from the month being analyzed to perform the following actions:

  1. Filter out all summary tasks and look only at real work tasks.
  2. Decide what to do with level of effort (LOE) – keep it or ignore it.
  3. Filter for all tasks that are completed (100% complete).
  4. Add up the baseline duration in days for all these completed tasks.
  5. Add up the actual duration days for these same completed tasks.
  6. Compare the actual duration days used to the baseline duration days.

An example would be:

  • 100 completed tasks
  • Total baseline days duration = 1,000
  • Total actual days duration = 1,500
  • Duration Performance = 1,000 / 1,500 = .67

One of the common IEAC formulas is the “SPI times CPI” that is calculated like this: ACWP + Budgeted Cost of Work Remaining (BCWR) / (CPI x SPI) where BCWR = Budget at Completion (BAC) – cumulative to date BCWP.

Now that we have a duration performance factor, we can develop a new IEAC. The Duration Performance IEAC would be done using the CPI from the same month as the IMS where ACWP + BCWR / (CPI x Duration Performance Index).

Using some actual data from a project for a single month we see:

  • Duration Performance Index = .82
  • BEI = .72
  • CPI = .92
  • SPI = .94 (significantly higher than the BEI)
  • ACWP = $9.2M
  • BCWR = $18.3M
  • IEAC using standard formula with CPI x SPI = $9.2 + $18.3 / (.92 x .94) = $30.3M
  • IEAC (Duration Performance) = $9.2 +$18.3 / (.92 x .82) = $33.5M

Assessing the Realism Ratio

When we look at the remaining tasks to be completed, we can use the Realism Ratio to assess how the future forecast durations compare to the performance so far.

The data needed are the baseline duration and the forecasted duration for all tasks that have not been started. This concept excludes in-process tasks. In our example from before, the data we created looked like this:

  • 100 completed tasks
  • Total baseline days duration = 1,000
  • Total actual days duration = 1,500
  • Duration Performance = 1,000 / 1,500 = .67

We would use the same IMS to do this:

  1. Filter out all summary tasks and look only at real work tasks.
  2. Decide what to do with LOE – keep it or ignore it.
  3. Filter for all tasks that are not started.
  4. Add up the baseline duration in days for all these tasks not started.
  5. Add up the forecasted duration days for these same tasks not started.
  6. Compare the forecasted duration days to the baseline duration days.

Let’s say there were 100 tasks not started. If the forecasted days were 1,000 and the baseline days were 1,000 that would yield 100%. When we did the example, the Duration Performance was .67. This means that performance to date was .67 but the future will be 100% or 1. You can see the disconnect. That disconnect we call the Realism Ratio (in this example, .67/1).

Data from the actual project for the same month as discussed earlier shows:

  • Duration Performance = 122% of baseline
  • Future Performance = .86 or 86% of baseline.

This means that the future durations are cut significantly.

We would use this data to develop a factor called a Realism Ratio (86/122 = .70) and that would be used to develop an IEAC using this formula: IEAC (Realism Ratio) = ACWP + BCWR / (CPI x Realism Ratio).

Using the same sample project data from above and adding in an assessment of the forecasted durations for the remaining work, we see:

  • Duration Performance = .82
  • BEI = .72
  • CPI = .92
  • SPI = .94 (significantly higher than the BEI)
  • ACWP = $9.2M
  • BCWR = $18.3M
  • Realism Ratio = .70
  • IEAC using standard formula with CPI x SPI = $9.2 + $18.3 / (.92 x .94) = $30.3M
  • IEAC (Duration Performance) = $9.2 +$18.3 / (.92 x .82) = $33.5M
  • IEAC (Realism Ratio) = $9.2 +$18.3 / (.92 x .70) = $37.6M

The project is not complete, so the final ACWP position is not known. There is a dramatic difference between the three IEACs. The difference between BEI and SPI indicates that in-process tasks and other factors such as LOE are potentially affecting SPI.

What can we learn from this sample project?

In this example, additional investigation is warranted. There are potential issues with the realism of the baseline and current schedule that are signaling a cost growth issue is likely to occur. Relying on just the time-phased cost data for IEAC calculations may not be sufficient to assess whether a contractor’s range of EACs included in their monthly cost performance reports are realistic. For more discussion, see the blog on Maintaining a Credible Estimate to Completion (EAC) and the blog on Using EVM Performance Metrics for Evaluating EACs.

Are there lurking cost growth surprises in your projects? You may want to consider revisiting your estimate to complete (ETC) and EAC process to verify there is an integrated assessment of the schedule and cost data to identify potential disconnects. H&A earned value consultants can provide an independent assessment of the quality of the data as well processes and procedures to help you verify your EACs are realistic. Call us today at (714) 685-1730.

Incorporating IMS Information Directly into Independent Estimate at Completion (IEAC) Formulas Read Post »

Tips for Producing an Earned Value Management System Description

, ,
Tips for Producing an EVM System Description Blog Post Banner Image.

There are a variety of ways a contractor can produce the documentation that describes their Earned Value Management System (EVMS), how it is implemented, used, and maintained. This is typically referred to as the EVM System Description (SD), though other names may be used. For example, it could be titled the Integrated Project Management System Description or Project Controls System Description to align with corporate or contractual naming conventions. EVM practices may be just one part of their overall project management system.

Regardless of the title, a contractor with an EVMS contractual requirement must be able to provide the necessary documentation to their customer to demonstrate their system complies with the EIA-748 Standard for EVMS guidelines. This includes any additional implementation guidance associated with the government agency responsible for conducting EVMS certification or validation reviews.

What is the purpose of an EVM System Description?

There are two purposes for an EVM SD; one is internal, the other is for the external customer.

The primary user of the EVM SD is project personnel such as project managers, project controls, schedulers, and control account managers (CAMs) responsible for implementing the EVMS on their project. It is essential they have a clear understanding of the required corporate EVM process and procedures as well as how to meet the intent of the EIA-748 guidelines using the applicable schedule, cost, analysis, risk, and other project control toolsets.

The government customer uses the EVM SD to gain an understanding of the contractor’s EVMS. The EVM SD must adequately document how the contractor’s system meets the intent of the EIA-748 guidelines. It should include a map of the EVM SD content to the EIA-748 guidelines or similar government customer checklist. The purpose of a government agency’s compliance review is to conduct a comprehensive assessment of a contractor’s EVMS. This includes the EVM SD as well as related processes and procedures. They also assess how the contractor has implemented the EVMS to verify the EVMS is providing timely, reliable, and auditable information.

Once the Cognizant Federal Agency (CFA) has determined the contractor’s EVMS complies with the EIA-748 guidelines, they conduct routine surveillance to ensure the contractor’s system as documented in the EVM SD and implemented on projects continues to comply with the EIA-748 guidelines. The contractor’s EVM SD is also a typical artifact required for an Integrated Baseline Review (IBR).

What needs to be included in the EVM SD?

An EVM SD should explain the methodology the contractor uses to comply with the EIA-748 guidelines as well as any government agency specific requirements. For example, DCMA uses the DoD EVMS Interpretation Guide (EVMSIG) and their Earned Value Management System Center Business Practice (BP) documents such as the BP 2 EVM System Description Review attachment EVMS Cross Reference Checklist (CRC). The DOE Office of Project Management (PM) uses their EVMS Compliance Review Standard Operating Procedure (ECRSOP) and related appendices including their Compliance Assessment Governance (CAG) document and EVMS Compliance Reference Crosswalk (CRC).

The EVM SD should provide an executive overview, reference the corporate EVMS policy, and address all of the subsystems that make up the EVMS. H&A earned value consultants have reviewed countless system descriptions over the years; contractors take a variety of approaches to discuss their subsystems.

Some contractors align with the EIA-748 five process areas (Organizing; Planning, Scheduling, and Budgeting; Accounting; Analysis and Management Reports; and Revisions and Data Maintenance). Others include additional sections covering indirect costs, material management, and subcontractor management. The planning, scheduling, and budgeting process area is often broken down into two sections – one for planning and scheduling and the other to cover work authorization and budgeting (a total of nine process groups). For more discussion, see the blog on the Benefits of Using Nine Process Groups.

A DOE contractor may align with the DOE CAG 10 subprocesses; this is similar to the nine progress group approach plus a section on risk and opportunity management. Other contractors use the project life cycle approach (initiation, planning, execution, monitor and control, and close out) to organize their content.

We recommend including a section on self-governance or self-surveillance (see Benefits of an EVMS Self-Governance Process). As noted in this blog, contractors with an approved EVMS are expected to establish and execute an annual EVMS self-governance plan.

The government customer expects contractors to map their EVM SD content to the applicable government agency EVMS compliance checklist. This is typically an appendix to the EVM SD. In most instances, this is the DCMA BP 2 EVMS Cross Reference Checklist or the DOE ECRSOP EVMS Compliance Reference Crosswalk. These checklists include attributes and/or questions that provide a more comprehensive guide to assess how a contractor meets the intent of the guidelines. The government customer also uses these checklists to identify and record the areas in the system documentation that meet the intent or note deficiencies the contractor needs to address.

The system description should include a concise description of what’s required, diagrams, illustrations, process flowcharts, as well as sample forms and reports with example data. In preparation for a compliance review, H&A earned value consultants often assist clients in creating an EVMS storyboard that visually depicts the entire system using the workflow diagrams along the inputs and outputs, and who is doing what using the applicable tool that demonstrates the system in operation.

Single or multiple documents?

A common question H&A earned value consultants are asked is whether the EVM SD should be a single document that includes the complete set of flowcharts, forms, and reports or a summary document with supporting procedures. Typically, the supporting procedures include the process flowcharts and sometimes the applicable artifacts (forms and reports). There are pros and cons to each approach.

Single Document Approach
Pros Cons
  • Provides an integrated view of the entire EVMS process.
  • Provides a complete discussion of a topic without having to reference multiple documents. Requirement discussion and process flowcharts with responsibility swim lanes along with example inputs/outputs provides a complete picture.
  • Configuration control is easier to manage, only need to make changes in one place.
  • Easier to search for a topic in a single document.
  • Easier to map the contents of a single document to the DCMA or DOE CRC.
  • Easier to create and maintain cross reference links between sections within a single document (See or See Also references).
  • For a company new to EVM, can appear to be an overwhelming task to produce a single, comprehensive document.
  • Can be a lengthy document.
  • More difficult to partition the content to different process owners to complete their section and to combine the content.
Summary Document with Supporting Procedures Approach
Pros Cons
  • Shorter summary document provides a general overview as a quick introduction to the EVMS. Can appear less daunting. Can be used as a strategy to introduce EVM concepts and incorporate into standard business practices.
  • Modular approach to creating and maintaining content. Can be easier to create the initial content.
  • Useful for targeted training using the individual procedures for a process area. For example, training focused on the steps required for developing the WBS and WBS dictionary with expected outputs.
  • Someone must review multiple documents to gain a complete understanding of the EVMS.
  • Fragmented and potentially siloed view of the system.
  • Potentially larger volume of content (over a single document), content is often repeated for context.
  • Configuration control. More difficult to maintain content to ensure consistency in multiple documents as well as maintain cross references between documents.
  • More difficult to map content in multiple documents to the DCMA or DOE CRC.

Regardless of which approach you take, keep in mind that the government customer will be approving the complete set of EVM SD documents (one or multiple documents). Any document referenced in the EVM SD is also subject to review. When you make changes to your EVM SD, the government customer will need to review and approve those changes to ensure continuing compliance with the EIA-748 guidelines. This is a formal process; changes must be processed through the contracting officer. 

Need help with your EVM System Description?

Whether you need to update your existing EVM SD or create one, H&A earned value consultants can help you to organize the content and artifacts in alignment with your business requirements. They also work with you to ensure your EVMS satisfies the EIA-748 guideline requirements as well as government agency specific requirements. H&A often assists with designing an EVMS and ensuring the project control software tools are configured to support the EVMS as well as verifying the quality of the data. For clients new to EVM, H&A offers a template that provides the basis to develop an EVM SD. This template is intended to assist clients with designing and implementing an EVMS that meets EIA-748 guideline requirements as well as the more rigorous requirements of specific government customers.

Call us today at (714) 685-1730 to get started.

Tips for Producing an Earned Value Management System Description Read Post »

Using Earned Value Management (EVM) Performance Metrics for Evaluating EACs

, , ,

A previous blog, Maintaining a Credible Estimate at Completion (EAC), discussed why producing a realistic EAC is essential to managing the remaining work on a contract. Internal management and the customer need visibility into the most likely total cost for the contract at completion to ensure it is within the negotiated contract cost and funding limits.

As noted in the earlier blog, one common technique to test the realism of the EAC is to compare the cumulative to date Cost Performance Index (CPI) to the To Complete Performance Index (TCPI).

Example of Using the Metrics for Evaluating Data

One example of documented guidance to industry for evaluating the realism of the EAC is the DOE Office of Project Management (PM) Compliance Assessment Governance (CAG) 2.0, and the related DOE EVMS Metric Specifications they use to assess the quality of schedule and cost data. This blog highlights the use of this guidance and how any contractor can incorporate similar best practices to verify EACs at a given WBS element, control account, or project level are realistic.

To refresh, the CPI is the efficiency at which work has been performed so far for a WBS element, control account, or at the total project level. The formula for the cumulative to date CPI is as follows.

Best practice tip: To ensure a valid CPI calculation, verify the BCWP and ACWP are recorded in the same month for the same work performed.

The TCPI provides the same information, however, it is forward looking. While the CPI is the work efficiency so far, the TCPI is the efficiency required to complete the remaining work to achieve the EAC. The formula for the TCPI is as follows.

TCPI Formula

Best practice tip: To ensure a valid TCPI, verify the BCWP and ACWP are recorded in the same month for the same work performed, and the BAC and EAC are for the same work scope. In other words, the scope of work assumptions are the same for the budget and remaining cost. This is why anticipated changes should not be included in the EAC.

The DOE uses the CPI in two of their assessment metrics and the TCPI in one, however, these are critical metrics partly because they are the only ones used to assess two different data evaluations: 1) commingling level of effort (LOE) and discrete work, and 2) EAC realism.

Commingling LOE and Discrete Work

The first use of CPI (no TCPI in this metric) falls under the Budgeting and Work Authorization subprocess. The primary purpose is to evaluate the effect of commingling LOE and discrete work scope has on control account metrics. The basic premise for this metric is that if the CPI for the LOE scope is significantly different than that for the discrete, the mixture of LOE in that control account is likely skewing overall performance reporting.

Here is the formulation DOE uses.

C.09.01:  Control Account CPI delta between Discrete and LOE >= ±0.1

X = Number of incomplete control accounts (WBS elements) in the EVMS cost tool, where

  1. The LOE portion of the budget is between 15% and 80% of the total budget, and
  2. The difference between the CPI for the discrete work and the LOE work is >= ±0.1.
Y = Number of incomplete control accounts (WBS elements) in the EVMS cost tool.
Threshold = 0%

Best practice tip: Run this metric quarterly on your control accounts that commingle LOE and discrete work packages. When there is a significant discrepancy between the performance of the LOE versus discrete work effort, consider isolating the LOE effort from the discrete effort at the earliest opportunity. An example could be the next rolling wave planning window or as part of an internal replanning action. Alternatively, it may be necessary to perform the calculations at the work package level to assess the performance of just the discrete effort when it is impractical to isolate by other means.

Process and procedure tip: Ensure the LOE work packages within a control account are kept to minimum (typically less than 15%), during the baseline development phase. This helps to prevent discrete work effort performance measurement distortion during the execution phase. A useful best practice H&A earned value consultants have helped contractors to implement during the budget baseline development process is to perform an analysis of the earned value methods used within a control account and the associated work package budgets. This helps to verify any LOE work packages are less than the 15% threshold for the control account. In some instances, it may be logical to segregate the LOE work effort into a separate control account. The objective is to identify and resolve the issue before the performance measurement baseline (PMB) is set.

EAC Realism

One DOE metric uses the TCPI and this involves a comparison to the CPI. This falls in the Analysis and Management Reporting subprocess. This DOE EVMS Metric Specification states: “This metric confirms that estimates of costs at completion are accurate and detailed.” As noted above, the metric compares the cost performance efficiency so far to the cost efficiency needed to achieve the EAC and is specific to the EAC a control account manager (CAM) would review for their scope of work. Depending on the level actual costs are collected, this analysis may need to be performed at the work package level instead of the control account level.  

Here is the formulation DOE uses assuming actual costs are collected at the work package level.

F.05.06:  Work Package CPI – EAC TCPI > ±0.1
X = Number of incomplete (>10% complete) work packages where CPI –TCPI > ±0.1.
Y = Number of incomplete (>10% complete) work packages in the EVMS cost tool.
Threshold = 5%

There is no requirement that the forecast of future costs has a linear relationship with past performance. While there may be legitimate reasons why future cost performance will fluctuate from the past, outside reviewers who receive EVM data will look for a trend or preponderance of data that would indicate the EACs are not realistic. When a significant number of active work packages are outside the ±0.1 CPI-TCPI threshold, it is an indication that the EACs are not being maintained or are driven by factors other than project performance.

Best practice tip: Run this metric every month for each active work package prior to month-end close. For those work packages outside the ±0.1 threshold, review the EAC to ensure it is an intentional forecast of costs given the current conditions.

Process and procedure tip: One of the training courses H&A earned value consultants often conduct is a Variance Analysis Reporting (VAR) workshop. This workshop is designed to help CAMs become more proficient with using the EVM metrics to assess the performance to date for their work effort, identify the root cause of significant variances, and document their findings as well as recommended corrective actions. This analysis includes verifying their estimate to complete (ETC) is a reasonable assessment of what is required to complete the remaining authorized work and their EACs are credible.


Additional References

Further discussion on using the CPI and TCPI to assess the EAC realism at the project level can be found in the DOE CAG, Analysis and Management reporting subprocess, Estimates at Completion. This section provides a good overview of comparing the cumulative to date CPI to the TCPI as well as comparing an EAC to calculated independent EACs (IEACs) for further analysis to assess the EAC credibility. 

Interested in learning more about using EVM metrics as a means to verify EACs at the detail or project level are realistic? H&A earned value consultants can help you incorporate best practices into your processes and procedures as well as conduct targeted training to improve your ETC and EAC process. Call us today at (714) 685-1730.

Using Earned Value Management (EVM) Performance Metrics for Evaluating EACs Read Post »

New IPMDAR DID and Implementation Guide

, ,
ALERT- New IPMDAR DID and Implementation Guide

The New Integrated Program Management Data and Analysis Report (IPMDAR) Data Item Description (DID) and Implementation Guide

On March 12, 2020, the Defense Department (OUSD/AAP) instituted the new Integrated Program Management Data and Analysis Report (IPMDAR), issuing the Data Item Description (DID) Number: DI-MGMT-81861B.
The IPMDAR is to be used for solicitations and RFPs for contracts with an EV reporting Requirement starting from March 12, 2020 forward. The IPMDAR can also be applied to modified contracts or to existing contracts (under the old IPMR or CPR requirements), but this has to be through a bi-lateral agreement (Government Program Office and Contractor).

Significant Change

This IPMDAR is a significant change from the previous iterations, the Integrated Program Management Report (IPMR) and the old Contract Performance Report (CPR). The IPMDAR has dispensed with the delivery of physical reports (Formats 1 – 7 of the old IPMR/ CPR), instead now requiring contractors to provide three (3) specific electronic data sets:

  • The Contract Performance Dataset (CPD)
  • The Schedule, comprised of
    • The Native Schedule File and
    •  The Schedule Performance Dataset (SPD)
  • The Performance Narrative Report, comprised of
    • The Executive Summary and
    • The Detailed Analysis Report

The DID states: “The IPMDAR’s primary purpose to the Government is to reflect current contract performance status and the forecast of future contract performance.”

Integrated Program Management Data Analysis Report (IPMDAR) Implementation & Tailoring Guide

Implementation & Tailoring Guide

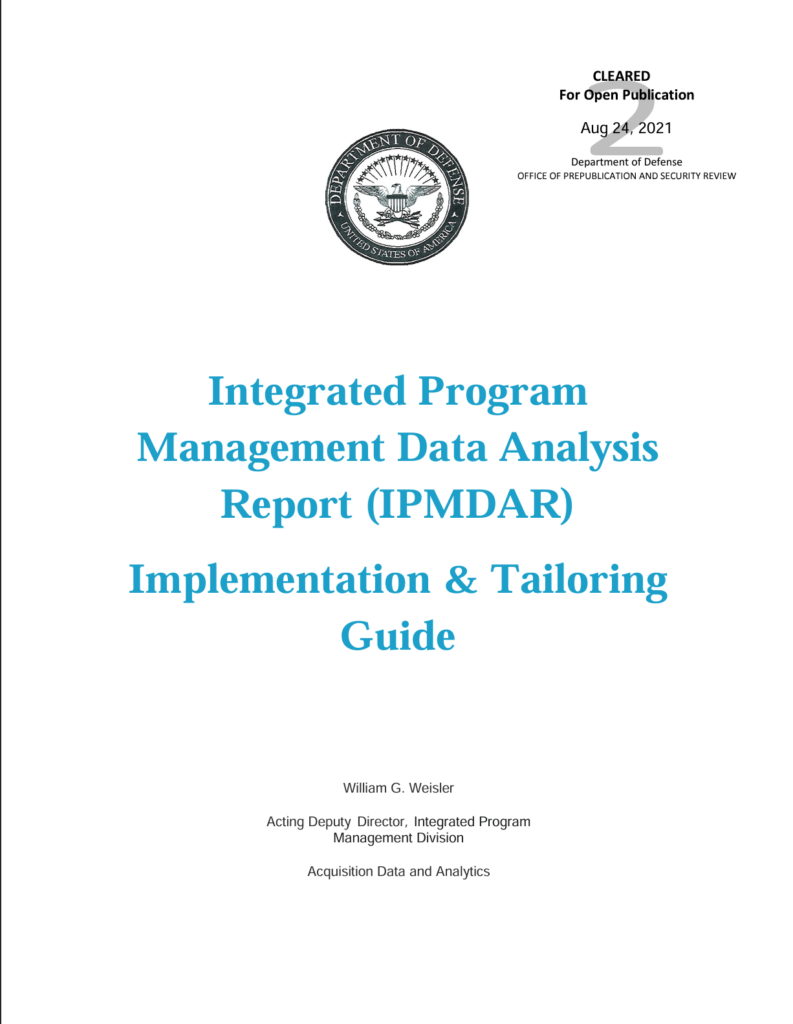
To help expedite the adoption of the New IPMDAR, on May 21, 2020, the AAP office also issued the 87-page Integrated Program Management Data Analysis Report (IPMDAR) Implementation & Tailoring Guide:
“This guide covers the application of the DID, how to tailor the DID in the Contract Data Requirements List (CDRL), and clarification on the intent of the DID.”

Interesting Features

The IPMDAR has introduced some interesting features that are clarified in the Guide:

  • The default reporting is at the Control Account, but there is the option to have Work Package Level reporting (negotiated item)
  • Reporting is by Hours and Elements of Cost (EOCs) (for either the CA or WP level)
  • Time-phased Future Baseline (BCWS) and ETC Forecast (for either CA or WP level)
  • Best Case/Worst Case/Most Likely EACs reported by hours and dollars
  • The Native Schedule is a direct export from the contractor’s scheduling tool
  • The SPD must match the CA or WP level negotiated
  • The Government may have any subcontractors provide the IPMDAR directly to the Government
    • Even if this is required, the subcontractors must still provide the IPMDAR data to their prime contractor
  • The IPMDAR reporting components must be delivered to EVM-CR not later than 16 business days after a contractor’s accounting period
    • Incremental deliveries may be authorized, but all the items must be in NLT the 16th business day and the incremental deliveries are negotiated. A potential example is IMS by third working day after close-of-month, the raw data by fifth working day, and format 5 narrative by the sixteenth working day.
  • Historical Contract Performance Data – The Government may request this “time-phased historical data from contract award” in place of the normally provided CPD (typically no more than annually).

Applicability

IPMDAR Applicability:

  • IPMDAR is intended to be applied completely (i.e., not tailored) for cost or incentive contracts ≥ $20M – unless tailoring is specified within the DID and coordinated with the Service/ Agency EVM Focal Point.
  • If EVM reporting is required on contracts less than $20M, tailoring is more flexible, BUT the Native Schedule and Performance Narrative Report are recommended.
  • IPMDAR typically not required on FFP.

Humphreys & Associates, Inc. can help you properly implement the new IPMDAR requirements, please contact us at (714) 685-1730

New IPMDAR DID and Implementation Guide Read Post »

Scroll to Top