EIA-748 Standard for EVMS Revision E Published
Quick Summary
- EIA-748 Revision E: a streamlined set of 27 guidelines (down from 32), reorganized for clarity and improved life cycle alignment, with minimal impact to existing EVMS implementations.
- Key updates: Merged, revised, and deleted guidelines to improve clarity, strengthen progress assessment, analysis, and change management.
- Impact to contractors: Most EVM System Descriptions will need remapping and potentially minor updates for estimated costs and ETC/EAC processes at the control account and program level. Training and internal surveillance materials will need to be updated.
The EIA-748 Revision E is now available for purchase on the SAE International standards organization website. Revision E is the culmination of the NDIA Integrated Program Management Division (IPMD) EIA-748 Committee’s efforts to produce a streamlined and revised set of 27 guidelines. As the author and steward of the EIA-748, the IPMD is responsible for working with SAE to maintain the EIA-748 standard following SAE’s protocols.
The NDIA IPMD EIA-748 Committee has also produced a draft IPMD EIA-748 Intent Guide to reflect the Revision E set of 27 guidelines. When it is completed and approved by the IPMD membership, this guide will be available for download from the NDIA IPMD Guides and Resources page.
This blog is an update to a previous 2025 blog, Planning Ahead for the EIA-748 Standard for EVMS Revision E.
Summary of Changes
The EIA-748-E guidelines are organized into the same five process categories as Revision D, with an update to the name of one category. The order of some of the guidelines changed to more accurately reflect the typical project life cycle process. Some guidelines were merged. Guideline text was also modified to improve clarity. Four guidelines were deleted. There are two new guidelines. The result is a final set of 27 guidelines, a reduction of five guidelines.
A summary of these changes by process category, along with an impact assessment, follows.
| Guideline Map | Process Category: Organization | ||
| 748 D | 748 E | Guideline Description | |
| D 1 | E 1 | 2.1a | Decompose Scope Using a Work Breakdown Structure |
| D 2 | E 2 | 2.1b | Identify Organizational Responsibilities for the Work |
| D 5 | E 3 | 2.1c | Integrate WBS/OBS to Create Control Accounts |
| D 3 | E 4 | 2.1d | Integrate Management Processes Using the WBS and OBS |
D Guideline 4, Identify Overhead Management, was deleted. Content was merged into E Guideline E 11.
Assessment: No impact as E Guidelines 1 to 4 reflect the same requirements as D Guidelines 1, 2, 3, and 5.
| Guideline Map | Process Category: Planning, Scheduling and Budgeting | ||
| 748 D | 748 E | Guideline Description | |
| D 7 | E 5 | 2.2a | Identify Indicators to Measure Progress |
| D 6 | E 6 | 2.2b | Schedule the Authorized Work |
| D 8 | E 7 | 2.2c | Establish and Maintain a Time Phased Budget Baseline |
| D 9 | E 8 | 2.2d | Authorize Scope, Schedule and Budget by Cost Elements |
| D 10, D 11 |
E 9 | 2.2e | Plan Scope, Schedule and Budget into Work Packages/Planning Packages |
| D 10, D 12 |
E 10 | 2.2f | Establish Work Package Performance Measurement Criteria |
| D 13 | E 11 | 2.2g | Develop/Apply Indirect Rates to Determine Indirect Budgets |
| D 14 | E 12 | 2.2h | Identify any Undistributed Budget and Management Reserve |
| D 11, D 15 |
E 13 | 2.2i | Reconcile to Target Cost Goals |
D Guideline 8 text on Over Target Budget (OTB)/Over Target Schedule (OTS) was moved to E Guideline 27. D Guidelines 10 (Determine Discrete Work) and 12 (LOE) were merged/modified and became E Guideline 10. D Guidelines 11 (Sum Detail Budgets to Control Accounts) and 15 (Reconcile to Target Cost) were merged/modified and became E Guideline 13. There are significant text modifications for E Guidelines 8, 9, 10, and 11 as a result of merging and editing the Revision D guidelines.
Assessment: Minimal impact as E Guidelines 5 to 13 reflect the same requirements as D Guidelines 6 to 15.
| Guideline Map | Process Category: Progress Assessment and Data Collection | ||
| 748 D | 748 E | Guideline Description | |
| ADD D 21 2) |
E 14 | 2.3a | Measure Progress and Determine Earned Value |
| D 16, D 19 D 21 1) |
E 15 | 2.3b | Collect Actual Costs for Work Performed by Cost Elements |
| D 21 3) | E 16 | 2.3c | Account for Purchased Material |
The title for the process category was modified to more accurately reflect the guideline requirements. New E Guideline 14 explicitly states the requirement to assess physical progress and calculate earned value. E Guideline 14 also discusses the most suitable time for claiming earned value for material. D Guidelines 16 (Record Direct Costs) and 19 (Record/Allocate Indirect Costs) were merged into E Guideline 15. D Guidelines 17 and 18 on summarizing direct costs by WBS/OBS were deleted as cost management software does this automatically. D Guideline 20 on identifying unit and lot costs was deleted; this is a separate business system function. D Guideline 21 numbered paragraphs were moved to E 14, 15, and 16 as noted above.
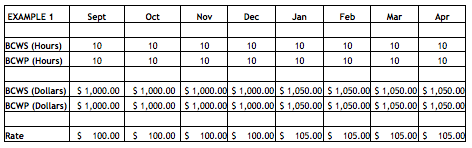
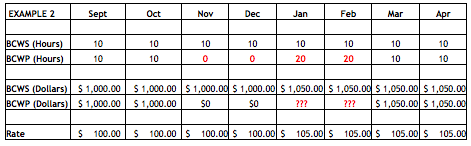
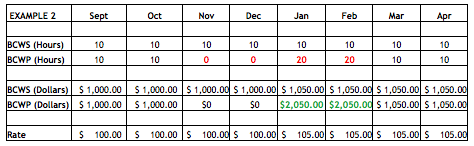
Assessment: Moderate impact. Clarified and streamlined requirements. One potential exception is text added to E Guideline 15 that states: “Where actual costs are not available for comparison, estimated costs will be entered into the EVMS.”
| Guideline Map | Process Category: Analysis and Management Reports | ||
|---|---|---|---|
| 748 D | 748 E | Guideline Description | |
| D 22 | E 17 | 2.4a | Generate Schedule and Cost Variances |
| D 23 | E 18 | 2.4b | Identify and Evaluate Significant Variances |
| D 24 | E 19 | 2.4c | Evaluate Indirect Cost Variances |
| ADD | E 20 | 2.4d | Update Control Account Estimates at Completion |
| D 25 | E 21 | 2.4e | Summarize, Review, Evaluate Performance Data and Variances |
| D 26 | E 22 | 2.4f | Implement Management Actions in Response to EVM Data |
| D 27 | E 23 | 2.4g | Develop Revised Program Estimate at Completion |
D Guideline 27 was split into two E guidelines to highlight the difference and purpose of the control account and program level EACs. E Guideline 20 was added to explicitly state the requirement to maintain control account level ETCs and EACs. E Guideline 23 text was modified for clarity and scope of the EAC at the program level.
Assessment: Minimal impact. Clarified requirements.
| Guideline Map | Process Category: Revisions and Data Maintenance | ||
|---|---|---|---|
| 748 D | 748 E | Guideline Description | |
| D 28 | E 24 | 2.5a | Incorporate Customer Directed Changes |
| D 29, D 32 | E 25 | 2.5b | Document and Reconcile Internal Replanning Changes |
| D 30 | E 26 | 2.5c | Control Retroactive Changes |
| D 31 | E 27 | 2.5d | Over Target Budget or Over Target Schedule |
The Revisions and Data Maintenance process category was significantly improved to eliminate redundancy and to separate out the three types of changes: 1) customer-directed, 2) internal replanning (merged D Guidelines 29 and 32), or 3) OTB/OTS situation. In all instances, retroactive changes must be controlled.
Assessment: Minimal impact. Clarified requirements.
Impact to Current Approved EVM System Descriptions
There should be minimal impact to EVM System Descriptions that are organized somewhat in alignment with the EIA-748 five guideline process categories or similar, more detailed process groups. In general, the requirements are unchanged; they have been simplified and streamlined.
For additional discussion on the impact on existing EVM System Descriptions, see this H&A EVMS Education Center article: Earned Value Management System Description Update Planning for EIA-748-E. At a minimum, current approved EVM System Descriptions will need to be remapped to the EIA-748-E 27 guidelines. In some instances, it may be necessary to verify that existing content supports the revised guideline text.
In particular, review content related to:
- Use of estimated costs (Guideline 15). Verify this is adequately addressed to ensure it is clear when estimated costs should be used, and the process project personnel should follow.
- Managing changes. Should it improve how the content is organized, considering aligning with the types of changes identified in Revision E. This may also simplify mapping the content to the Revision E guidelines.
- ETC/EAC process. Confirm content is clear on purpose, scope, and requirements at the control account and the program level.
- Self-surveillance/self-governance. Review the content to determine what may need an update. Should the content also be used for conducting subcontractor surveillance, additional updates may be needed for the internal teams conducting these reviews.
Other Considerations for EVM System Description Updates
‘The Cognizant Federal Agencies (CFAs), such as DCMA, will need to update their EVMS compliance and surveillance processes and materials to reflect the EIA-748-E. The government entities, such as DCMA, NASA, and DOE, responsible for EVMS compliance and surveillance reviews, participated in the IPMD joint industry and government team that produced the final set of guidelines. They are aware of the changes and have been planning to make the necessary updates to documents such as the DoD EVMS Interpretation Guide (EVMSIG). The updates will also impact the DCMA compliance and surveillance review materials, such as their Guideline Evaluation Templates (GET). Updates to documents such as the EVMSIG also have the potential to impact content in a contractor’s EVM System Description.
Next Steps
Start the process to remap your EVM System Description to the EIA-748-E set of 27 guidelines and verify the content supports the requirements in Revision E. As you are working through the content, look for opportunities to trim wordy text, improve clarity, or update examples. Perhaps workflow steps can be simplified if you have implemented software updates or new tools. Your training materials will likely need a refresh. If you have a CFA-approved EVMS, plan to coordinate with them on the updates to your EVM System Description as they will need to review your changes.
H&A earned value consultants often review EVM System Descriptions against the EIA-748 Guidelines and provide recommendations to address any gaps. If you need an independent third party to assess your EVMS documentation or related procedures to identify what could be improved or clarified to better align with the EIA-748-E, give us a call today at (714) 685-1730.
EIA-748 Standard for EVMS Revision E Published Read Post »