Including Level of Effort (LOE) in the Integrated Master Schedule (IMS)

A recent H&A blog titled “Level of Effort (LOE) Best Practice Tips” discussed different approaches for handling LOE to avoid generating false variances. That discussion did not elaborate on including the LOE tasks in the integrated master schedule (IMS). This blog is a follow on to that earlier discussion with a focus on options for including LOE in the IMS along with notes on best practices, tips, and customer expectations.
In the general sense of an earned value management system (EVMS), the LOE scope of work is contained in summary level planning packages (SLPPs) or control accounts as subordinate planning packages or work packages. The budget values for those elements will most likely come from a resource loaded IMS or a resource loading mechanism aligned with the IMS. Not all organizations resource load the IMS activities but instead extract time buckets from the IMS for resource loading using other mechanisms. Resource loading the IMS activities is the recommended practice because it assures cost/schedule integration, but it can be difficult.
LOE work might not appear in the IMS since it is considered optional by some customers such as the Department of Defense (DoD). The Department of Energy (DOE) requires LOE tasks to be included so you can expect it to be in the IMS when DOE is the customer.
Before we talk about LOE in the IMS we must think about the type of work the LOE tasks represent. LOE might be a general task such as “Control Account Management” that is not directly related to other work except perhaps in the time frame in which they happen. But some LOE tasks such as support tasks are related to other discrete work. Modeling the LOE in the IMS starts by understanding what type of effort is involved and can help to determine the approach for linking activities.
LOE Best Practice Tips Related to the IMS
The Level of Effort (LOE) Best Practice Tips blog included these points related to the IMS:
- “When LOE activities are included in the schedule, they should not drive the date calculations of discrete activities in the integrated master schedule (IMS). They should also not appear on the critical path.”
- “LOE must be segregated from discrete work effort. In practice, this means a work package can only be assigned a single earned value method.”
- “Consider shorter durations for the LOE when that LOE is supporting discrete effort. Should the first occurrence of the LOE trigger a data anomaly test metric, it can be proactively handled along with any future replanning. The remaining LOE would already be in one or more separate work packages so there won’t be any criticism for changing open work packages.”
Government Agency and Industry Guidance on LOE on the IMS
Is there any guidance that can help clarify how best to handle LOE tasks in the IMS? Let’s take a look at three of the guidance documents that may be useful for your environment.
- The Integrated Program Management Data and Analysis Report (IPMDAR) Data Item Description (DID), DI-MGMT-81861C (August 2021). This DID is typically placed on contracts with the DoD or NASA that exceed the contract value threshold for EVM reporting or EVMS compliance. Relevant mentions of the data requirements for the IMS in the DID are as follows.
“2.4.1.1 Content. The Schedule consists of horizontally and vertically integrated discrete tasks/activities, consistent with all authorized work, and relationships necessary for successful contract completion.”
Note: This is where the option to exclude LOE from the IMS appears since this requires only discrete tasks/activities. The following sections provide additional guidance when LOE is included in the IMS.
“2.4.2.7 Level of Effort (LOE) Identification. If tasks/activities within an LOE work package are included in the Schedule, clearly identify them.”
“2.4.2.9 Earned Value Technique (EVT). Identify the EVT (e.g., apportioned effort, level of effort, milestone).”
- National Defense Industrial Association (NDIA) Integrated Program Management Division (IPMD) Planning and Scheduling Excellence Guide (PASEG) (Version 5.0). The PASEG is a widely recognized industry guide on scheduling best practices in government contracting environments. Section 5.8, Level of Effort (LOE) provides a discussion on the topic including things to promote and things to avoid. Excerpts from the PAGEG follow.
“There are pros and cons around including or excluding LOE tasks in the IMS. Including LOE tasks in the IMS allows for a more inclusive total program look at resource distribution, which aids in the maintenance and analysis of program resource distribution. However, if modeled incorrectly, including LOE tasking in the IMS can cause inaccurate total float and critical path calculations.”
“Tasks planned as LOE in the IMS should be easily and accurately identifiable. This includes populating the appropriate Earned Value Technique field (as applicable) and possibly even identifying the task as LOE in the task description.”
“Consider adding an LOE Completion Milestone to tie all LOE tasking to the end of the program.”
“LOE tasks should not be networked so that they impact discrete tasks. Incorrect logic application on LOE can lead to invalid impacts to the program critical path.”
“Level of Effort tasks should have no discrete successors and should therefore never appear on critical/driving paths.”
- DOE Guide 413.3-24 Planning and Scheduling (April 2022). This document provides guidance for acceptable practices in a DOE contractual environment. The discussion on LOE can be found in Section 7 Planning and Scheduling Special Topics, 7.2 Level of Effort, and 7.3 Inclusion of Level of Effort in the Integrated Master Schedule. Excerpts and image from the Guide follow.
“Overview: Activity-based methods either cannot, or impracticably can measure the performance of LOE WPs and activities. Include all activities, both discrete and LOE, in the IMS.”
“LOE is planned in the IMS so that it does not impact discrete work. Figure 6 shows the recommended linkages in the IMS for planning level of effort.”
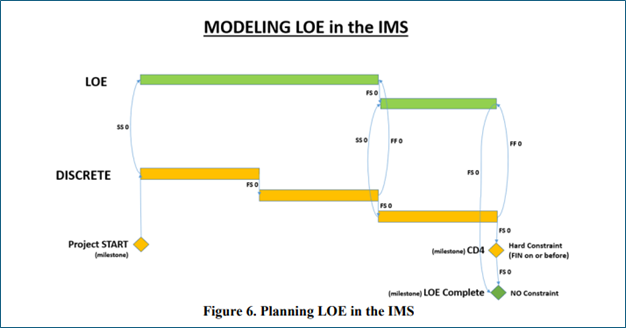
Interpreting this DOE Guide diagram for the recommended modeling of LOE in the IMS, notice the inclusion of a “LOE Complete” milestone following the Critical Decision (CD) 4 milestone with no constraint. CD4 in this diagram represents the end of contract effort. The purpose of this LOE-complete milestone, with no constraint, is to provide a successor for all LOE tasks where one is needed. That will prevent generating issues where tasks have no successors.
This recommended modeling is done so that the LOE tasks are not linked to the end of the contract work and thus will not push it. The LOE tasks will also not appear on the critical path since they are not in the path that established the end date.
Also note that the LOE tasks in green are linked as successors to discrete work which is a logic linking approach intended to keep the LOE work aligned with the discrete work but off the critical path. Study the logic and you see that a movement to the right of a discrete task will drag along its related LOE task.
DOE requires the use of Primavera schedule tools so the relationships shown here can be accomplished in that tool. That may not be true of all tools. Know how your tools work before you generate any guidance.
Additional Relevant Guidance Search
H&A earned value consultants recently conducted a survey of the various government and non-government documents regarding the IMS and collected relevant guidance related to LOE among other things. The table below lists the results from a search for “LOE” wording. Note: this is a representative sample of typical government agency and industry IMS references. You should verify current references before you generate your own internal IMS guidance.
| Source Document | Guidance for Capturing all Activities, LOE in IMS |
|---|---|
| DCMA EVMS Compliance Metrics (DECM) Checks (version 6.0) |
|
| IPMDAR DID DI-MGMT 81816C | If tasks/activities within an LOE work package are included in the Schedule, clearly identify them. |
| DOE Guide 413.3-24 Planning and Scheduling, Appendix A Schedule Assessment Principles | Principle 20. No LOE on critical path. |
| GAO Schedule Assessment Guide: Best Practices for Project Schedules (December 2015) | Selected excerpts:
|
| NDIA IPMD PASEG (version 5.0) (as noted above) |
|
| PMI Practice Standard for Scheduling (Second Edition) | Since an LOE activity is not itself a work item directly associated with accomplishing the final project product, service, or results, but rather one that supports such work, its duration is based on the duration of the discrete work activities that it is supporting. |
Conclusion
Based on the various sources of guidance, it is possible to structure the IMS to include LOE in a way that provides cost/schedule integration and keeps all work correctly aligned yet does not cause issues with the critical path and the driving paths. From this guidance, it should be a straightforward effort to generate your own internal scheduling procedure defining how to handle LOE in the IMS if you choose to include it or if you are required to include it.
Need help producing a clear and concise scheduling procedure or tool specific work instructions? H&A earned value consultants and scheduling subject matter experts have worked with numerous clients to create easy to follow guides that help to ensure schedulers are following your company’s best practices using the scheduling tools of choice. Call us today at (714) 685-1730 to get started.
Including Level of Effort (LOE) in the Integrated Master Schedule (IMS) Read Post »


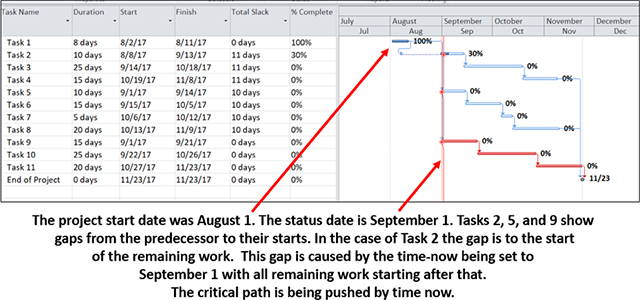
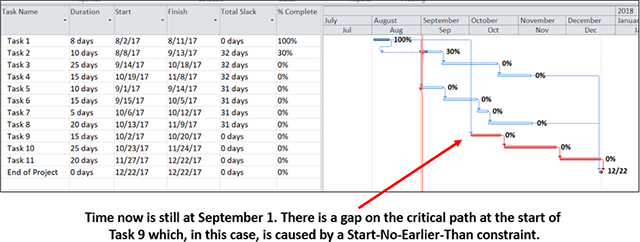
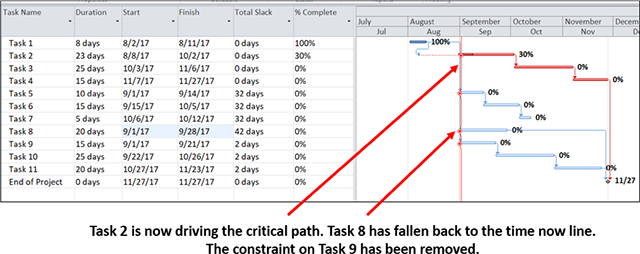
 Recently one of our consultants was instructing a session on the