Introduction to the Cost and Software Data Reporting (CSDR) Reporting Requirements
A common client request is to assist them with sorting through the various DoD contractual reporting requirements and contract value reporting thresholds that apply. We frequently run into situations where a contractor needs clarification on why they have a Cost and Software Data Reporting (CSDR) requirement and whether they should seek to waive the requirement. Subcontractors to a prime often question the requirement to provide actual cost data directly to the DoD, especially for Firm Fixed Price (FFP) contracts.
Background
CSDRs are the primary means the DoD uses to collect data on the development, production, and sustainment costs incurred by contractors performing DoD acquisition contracts. It is a DoD system for collecting actual costs, software data, and related business data. The resulting data repository serves as the primary source for contract cost and software data for most DoD resource analysis efforts including cost database development, applied cost estimating, cost research, program reviews, analysis of alternatives (AoAs), and life cycle cost estimates.
CSDR reporting requirements are determined by the contract value regardless of the acquisition phase and contract type. In general, CSDR reporting is required for Acquisition Category I-II programs and Information System (IS) programs valued at more than $50M. They can also be required for Middle Tier Acquisition programs (greater than $20M) and other programs (greater than $100M). Risk can also be a determining factor regardless of the contract value.
DoD Instruction (DoDI) 5000.73, Cost Analysis Guidance and Procedures (March 2020), provides additional details about the cost data reporting. Table 1 in the 5000.73 lists the cost reporting requirements contract value thresholds. The DoD Manual 5000.04 Cost and Software Data Reporting (May 2021) is the primary requirements document for the development, implementation, and operation of the DoD CSDR system to ensure data reported is accurate and consistent.
About CADE
The Office of the Secretary of Defense Cost Assessment and Program Evaluation (OSD CAPE) established the Cost Assessment Data Enterprise (CADE), a secure web-based information system that hosts the controlled unclassified CSDR repository, the Defense Acquisition Cost Information Management System, and the forward pricing rate library. CADE also contains a selected acquisition report database, a contracts database, data analytics capabilities, and a library containing cost estimating content such as cost analysis requirement descriptions and cost estimates. CADE is access-controlled, and available through the public-facing CADE Portal website.
Similar to the cost estimating and proposal pricing functions within contractor’s organizations that rely on historical actual costs to assess the validity of a proposed cost estimate, independent and sound cost estimates are vital for effective DoD acquisition decision making and oversight. CADE plays a critical role in capturing the expenditure, technical, and programmatic data after contract execution in a consistent manner to enable independent cost estimating and analysis. This cost estimate data is essential to support efficient and effective resource allocation decisions throughout the planning, programming, budgeting, and execution process for the DoD.
CSDR Reporting Requirements
There are a series of Data Item Descriptions (DIDs) for this reporting requirement. Some forms are submitted electronically using DoD defined XML schemas, Excel, or JSON encoded data in accordance with a File Format Specification (FFS) and Data Exchange Instruction (DEI). The list of DIDs are as follows. These DIDs can be downloaded from the CADE website.
- Contract Work Breakdown Structure, DI-MGMT-81334D (May 2011).
- Cost Data Summary Report, DI-FNCL-81565C (May 2011), DD Form 1921, XML Schema.
- Functional Cost-Hour Report, DI-FNCL-81566C (September 2015), DD Form 1921-1, XML Schema.
- Progress Curve Report, DI-FNCL-81567C (May 2011), DD Form 1921-2, XML Schema.
- Sustainment Functional Cost-Hour Report, DI-FNCL-81992 (May 2011), DD Form 1921-5, XML Schema.
- Contractor Business Data Report, DI-FNCL-81765C (March 2021), DD Form 1921-3, Excel.
- Software Development Report, DI–MGMT-82035A (October 2022), DD Form 3026-1, XML Schema.
- Software Maintenance Report, DI–MGMT-82035A (October 2022), DD Form 3026-2, XML Schema.
- Enterprise Resource Planning (ERP) Software Development Report, DI-MGMT-82035A (October 2022), DD Form 3026-3, XML Schema.
- Cost and Hour Report (FlexFile), DI-FNCL-82162 (November 2017), JSON encoded data file following FFS and DEI.
- Quantity Data Report, DI-MGMT-82164 (November 2017), JSON encoded data file following FFS and DEI.
- Maintenance and Repair Parts Data Report, DI-MGMT-82163 (November 2017), Excel.
- Technical Data Report, DI-MGMT-82165 (November 2017), Excel.
The Cost and Hour Report (FlexFile) and Quantity Data Report play a critical role in collecting cost data from contractors for the DoD data repository because they use JSON data encoding to organize the content. They are intended to replace the legacy 1921 series of paper-based formats including the DD 1921, 1921-1, 1921-2, and 1921-5. It also requires contractors to provide significantly more historical cost data than the 1921 formats. As a result, the DoD cost estimating community has additional insight into historical costs. The goal is to establish a common framework and standard nomenclature to collect data from different contractors, all of them with unique cost accounting structures, that are mapped to the DID, FFS, and DEI requirements for use in the data repository.
Establishing a Consistent, Repeatable Process to Produce the CSDR Data Deliverables
For contractors new to the CSDR reporting requirements and in particular, the FlexFile JSON data encoding, can appear to be daunting. That’s where software tools such as those from Midnite Dynamics can help. Midnite Dynamics specializes in assisting contractors with producing the CSDR data deliverables.
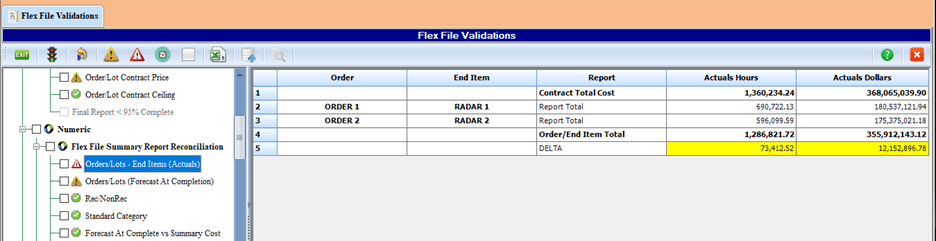
Their software tool, C*CERT+, streamlines, automates, validates, and produces the legacy 1921 family of Excel and XML reports as well as the FlexFile and Quantity Data Report JSON submittals. C*CERT+ eliminates what otherwise is a manually intensive, resource draining, tedious and costly effort subject to recurring rejections. It is one thing to create the required legacy reports or FlexFile JSON files for submittal, it is another to pass the submittal validation process. C*CERT+ provides numerous data validations and analysis reports to ensure the data is 100% compliant before it is submitted. For example, the software includes over 90 FlexFile validations to ensure data compliance as illustrated in Figure 1.
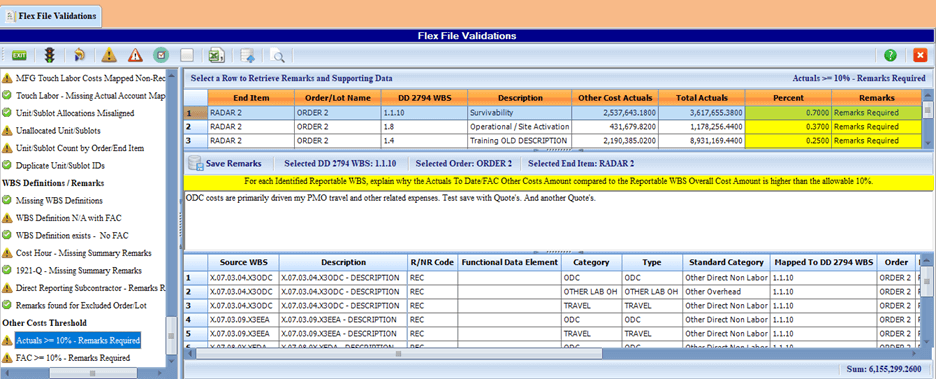
The software includes a Validation and Remarks utility to analyze the source data details that could result in a Validation Trip. Remarks can be entered directly into the validation module for anything that requires an explanation. This is illustrated in Figure 2. This narrative is included with the data submittal.
C*CERT+ also interfaces with existing EVM cost tools and accounting systems to produce the existing legacy 1921 reports, the FlexFile, and other data submittals as well as to consolidate separate projects/CLINs/task orders into a single contract report.
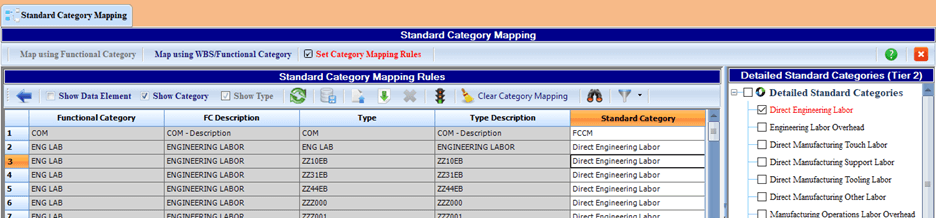
Once the C*CERT+ Standard Category Mapping Rules are set up, they can be shared throughout the corporation or business unit to establish a standard and repeatable process for producing the data deliverables. This mapping process translates the contractor’s source data into an output that matches the CSDR data submittal format rules. This saves a tremendous amount of time and makes it much easier to consistently produce the CSDR data deliverables. An example of the Mapping Rules is illustrated in Figure 3.
Do your process and procedures or training materials need an update to include specific guidance for project control teams to produce required DoD contractual reports or data submittals using your tool sets of choice? Give us a call today at (714) 685-1730 to get started.
Introduction to the Cost and Software Data Reporting (CSDR) Reporting Requirements Read Post »