EVM (Earned Value Management) vs. Agile Project Management

, , , , , , , , , , , , ,

This article provides an introduction to the differences between an Earned Value Management System (EVMS) and Agile approaches on projects, and isolates the challenges of implementing an EVMS on a project where the project management has chosen to follow an Agile approach to the development work. The article explores the principles of EVMS and of Agile, and contrasts them to show where there are inherent conflicts. The article then discusses how the conflicts can be mitigated so that the benefits of both the EVMS and Agile can be obtained from a joint implementation.

Controlled Planning with EVMS

Controlled Planning with EVMS

Earned Value Management (EVM) Background

Earned Value Management is a 50 +/- year old methodology based on widely accepted principles that applies documented, systematized practices to support the processes of organizing, planning, directing, and controlling large complex projects, of any nature, which contain a high degree of uncertainty.

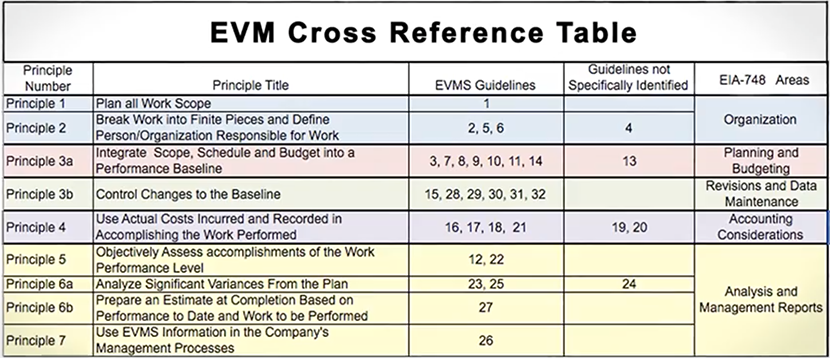
An EVMS is structured compliant to 32 guidelines that define what a project management information system should be capable of doing to support the program management team. Within the 32 guidelines there is a subset of generally recognized core principles. The core principles are:

  1. Organize the entire scope of the project using a Work Breakdown Structure (WBS).
  2. Organize the project team using an Organization Breakdown Structure (OBS).
  3. Integrate the project work with the project team to create management control points (Control Accounts).
  4. Schedule the project work in the Control Accounts across the entire project duration at the appropriate level of detail.
  5. Establish time-phased budgets for the scheduled work in the Control Accounts.
  6. Establish the scope/schedule/budget baseline as the Performance Measurement Baseline (PMB).
  7. Authorize the scope/schedule/budget and control the start/stop of work.
  8. Periodically measure the schedule and the value of completed work and determine the Earned Value.
  9. Record direct costs (actual costs) and summarize into the Control Accounts.
  10. Compare planned, accomplished, and spent to analyze the performance and associated variances.
  11. Develop realistic time and cost estimates for the remaining effort in the Control Accounts.
  12. Rigorously control changes to the Performance Measurement Baseline.

The EVM concept presented in these guidelines is a sound management approach, that once incorporated on any type of program, whether research and development, construction, production, etc. provides all levels of management with early visibility into cost and schedule problems.  Earned Value Management now appears as a contractual requirement on programs world-wide.  Primary EVM users include the United States, Europe, England, Canada, Australia, China, and Japan. It is a requirement of many U.S. Government agencies, including the Department of Defense (DoD), the National Aeronautics and Space Administration (NASA), the Department of Energy (DOE), the Intelligence Community, the Department of Homeland Security (DHS), the Federal Aviation Administration (FAA), the Department of Transportation (DOT), Health and Human Services (HHS), and others.

EVMS has been adopted by companies in situations where it is not a contractual requirement so that they can gain the discipline and benefits of the structural management approach discussed in the guidelines.


evms 2

Flexible Planning with Agile

Agile Background

Agile is a 20 +/- year old approach to applying a mindset that values the use of small, empowered, self-organizing, multi-functional teams, mainly in software development, to establish a test driven product development effort. This uses a series of short, rapid incremental builds within projects with a high degree of uncertainty to achieve shorter development times, lower costs, and products more closely aligned with customer requirements.

Agile does not usually appear as a contractual requirement. The concept is adopted by companies and organizations with the belief that a better product will be produced faster, and with less expense, using this approach than if traditional approaches were followed.

There are a core set of principles for Agile that were initially established in the copyrighted Agile Manifesto. These delineated core principles are:

  1. Early and continuous product delivery.
  2. Deliver working software (product) frequently.
  3. Expect change and respond positively to change.
  4. Developers and project business organization (PMO) work together.
  5. Product-focused build teams are at the core.
  6. Support self-organizing teams – trust among peers.
  7. Encourage face-to-face discussions (involve the user/customer).
  8. Working software is the measure of progress.
  9. Maintain a constant sustainable pace of development.
  10. Simplify the process and the product.
  11. Put the highest value on technical excellence.
  12. Improve team effectivity.

So How Does Agile Work?

The Agile mindset or approach is implemented through a process of defining the product backlog into smaller and smaller subsets of work that are structured in a top down fashion. At the lowest level of product backlog, the work elements or requirements can be prioritized and assigned to teams. The self-organizing teams pull work from the backlog and work the tasks to completion in a series of short, time-fixed Sprints or iterations. Sprints are often from 2 to 4 weeks long.

Because the teams are self-organizing, there is no team manager or team lead. The teams work as a group and only pull from the backlog at the last possible minute, and do minimal planning for each Sprint. If the product backlog is properly deconstructed and defined into user stories, then the planning meeting for an entire 4 week Sprint can be accomplished in a few hours.

The teams design, code, test, integrate, and deliver functionality in every Sprint. Since tested product is output every few weeks, all on the project can see the product being created and can contribute along the timeline, as needed, to provide a complete finished product.

The product owner embodies the customer’s perspective and either accepts or rejects the team’s work.  At the latter point of each Sprint, the tested product is demonstrated to the product owner.

High Level Side-by-Side

The two approaches are contrasted in the chart shown below. The EVMS is a methodology that is highly documented and highly systematized, while Agile is just the opposite. It is more of a mindset than a methodology with the preference not to have significant process documentation.

The EVMS is applied to entire projects and contracts, while generally Agile is applied to software portions of projects.  However, it could also be used on other development work.

The EVMS is usually a contractual requirement with significant implementation and operation constraints while Agile has none of these. As a contractual requirement, the EVMS carries with it the option for customer reviews and the threat of non-compliance, which entails penalties.

EVM Agile
Methodology Mindset
Documented Self-defined
Systematized Self-defined
Any type of project Software development (mainly)
High degree of uncertainty High degree of uncertainty
Applied to the entire project Applied to portions of the project
Often a contractual requirement Adopted not required

Lower Level Side-by-Side

In addition to the high level side-by-side, there are significant differences within the details of the two approaches. These are shown in the side-by-side table below.

Agile EVMS
Minimal documentation More documentation
Plan at last moment Plan ahead to end of project
Scope is flexible Scope is baselined and controlled
Expect and embrace change Avoid and/or control change
Schedule (Sprint) is fixed.  Timebox ends the Sprint. End the package when the work is done.
Budget is secondary Budget is baselined and controlled
Cost collection is not mentioned. Cost collection at the right level is critical

Accommodate and Capitalize on Differences

It is possible to implement Agile along with an EVMS if the EVMS application is set up to accommodate the differences and capitalize on them.

For example, the main reason that Agile’s embrace of change is a potential problem within an EVMS is because often the EVMS is used to plan too far in advance, and then reacting to change is difficult and expensive. If short term planning in the EVMS can be coordinated with the Agile planning, then the two can coexist.

The Agile free acceptance of scope changes within the backlog runs counter to the EVMS imposition of baseline change control. But if the EVMS baseline can be carefully set at a work level above the busy lowest level ups and downs, the impact to baseline change control is manageable.

A surprising chance to capitalize on Agile, within the EVMS, is found in the Scrum team approach in Agile where the team breaks work down into tasks far below what would normally be done in an EVMS, and then meets daily to update progress and provide corrective action. This low level constant attention means that the EVMS benefits from a better look at real progress as assessed by the real performers.

Not all the compromise needs be on the EVMS side of the equation. The Scrum team operations will often be defined to have the least possible recording of what happens during the Sprint. Since the product is king, then only the product really matters. But that misses the opportunities to capture the actions of the team for analysis, and use in upgrading their skills later. Necessary compromises would include some additional recording of the daily actions of the team and capturing the progress and problems. These would then be used in the EVMS functions of performance measurement, variance analysis, and corrective action planning.

One other compromise in the Agile realm that would be needed is the adoption of some minimum documentation of processes so that team operations can be repeatable and stable. Even a self-organizing team cannot change the way they work every time it wishes. That would raise the risk of a chaotic work environment.

These topics are recapped in the table below.

Agile EVMS Accommodation
Scope is flexible Select a higher level package for the baseline
Change is expected and embraced Have the shortest possible planning horizon
Plan at the last possible minute Have the shortest possible planning horizon
Daily Scrum Stand-up Meeting Collect the data and use it for performance measurement
Sprint Review Meeting Use for periodic measurement and analysis
Sprint Retrospective Meeting Use in Corrective Action Plans
Lack of documentation Add minimum documentation to stabilize team operations

Bottom Line

Implementing an EVMS is a challenge itself. Implementing Agile is a challenge too; perhaps a more difficult challenge. Implementing the two approaches side-by-side can seem impossible. But it is possible and even beneficial if done in a way the makes needed accommodations in both arenas for the project’s benefit.

EVM (Earned Value Management) vs. Agile Project Management Read Post »

Earned Value Management: How Much Is Enough?

, , , , , ,

How Much EVMS Is Enough

I took the scenic route to selecting the theme of this blog. First, it was suggested that I write a blog on the benefits and costs of the earned value process as it applies to program management. Next it was suggested that I describe the harm of not using any of the elements of the earned value process.

In the case of the benefits and costs of the earned value management process, it would be difficult to improve upon Dr. Christensen’s 1998 paper on this heading or to attempt to improve other papers and studies done by Wayne Abba, Gary Humphreys, Gary Christle, Coopers & Lybrand and others. So I will not make citations to these past studies. Rather I will leave them undisturbed, as the monuments they have become.

This blog will summarize my observations of how companies have chosen “how much EVM is enough” for them and share my observations of the results of these decisions. Each company has selected an EVM implementation strategy and each company’s strategy falls along a bounded continuum.

I will describe this continuum of company EVM strategies with a left hand and a right hand goal post, and the space between as a cross bar. The “left hand goal post” represents companies that elect to be very poor at EVM or to not use EVM at all. The “right hand goal post” represents companies that have committed to being “best-in-class” practitioners of the EVM process and are the polar opposite of the companies at the left hand goal post. There are few companies at either the left or right hand goal posts. The “cross bar” represents the vast majority of companies that have selected an EVM strategy somewhere between the left and right goal posts.

Two Goal Posts And A Cross Bar; Recalcitrant, Merely Compliant, Efficiently Expert

There are as many strategies to earned value management as there are companies using EVM to manage their programs and projects.

Left Goal Post; The Recalcitrant

I have firsthand experience with a company, that at the time I initially joined them and had decided to ignore earned value management even though it was a requirement in several of its contracts. After many painful years of attempting to maintain this recalcitrant EVM strategy, this company decided that a better strategy would be to become “efficiently expert” at EVM.

Cross Bar; Merely Compliant at EVM

It has been my experience that most companies desire to “become EVM compliant,” which generally means being compliant to the 32 guidelines and not failing those guidelines so as to be de-certified. This is the vast middle ground between the two goal posts. I will now share five observations regarding companies in the “cross bar” majority.

Observation #1: Compliance As A Goal; Golf and EVM

Compliance should be a “given,” or a “pre-condition,” not a “goal.” Remaining merely compliant implies a status quo or static posture.

I will use the game of golf as an analogy. Golf is a game of honor and compliance to well established rules. All PGA professional tour golfers “comply” with the rules that govern golf. Although all PGA tour pro golfers comply with these rules, their performance on tour differs dramatically.

Fifty-three percent of all PGA golf pros, past and present, have no tour wins. That means only 47% of all PGA tour golf pros have won at least a single PGA tour. There are seven players in the history of the PGA that have fifty or more tour wins. If the bar is lowered to forty or more wins, only three players are added to the list. If the bar is lowered yet again to thirty or more tour wins, only eight more players are added to the list. Only 18 golfers have won 30 or more PGA tournaments.

Professional golfers do not confuse compliance with performance, nor do these professionals assume that “being compliant” will improve their performance.

Observation #2: “The Tyranny of The Status Quo”

With apologies to Milton Friedman and his book of the same name, companies that attempt to maintain mere guideline compliance will do no better than the status quo, and more often than not, regress toward non-compliance. Maintaining status quo is a myth – you either improve or regress.

All professionals, companies included, must compete in their markets and selected fields. To succeed in this competition requires constant improvement in areas critical to success. A company, organization, or individual without the means or the desire to improve will eventually fail and perhaps perish.

Observation #3: Blaming The Scoreboard

As a program manager, I considered EVM as my scoreboard. I reacted to the EVM data – the scoreboard – and made decisions based on that data (GL #26).

I recall the 2014 Super Bowl’s final score: Patriots 28, Seahawks 24. Did the scoreboard cause the Seahawks to lose the game or did a poor decision by their coach cause the loss? Imagine a coach that cannot see the scoreboard. That coach does not know the score or how much time remains. That coach cannot react to the realities of the game.

Observation #4: EVM Causes Poor Program Performance

I have witnessed several company leaders assert that the use of EVM on a poorly performing program is the cause of that program’s poor cost and schedule performance. A correlation between two variables, or a sequence of two variables (use of EVM and poor performance), does not imply that one caused the other. This is the logical fallacy known as “X happened, then Y happened, therefore X caused Y.” Night follows day, but day does not cause night. Use of EVM does not cause poor program performance. Not reacting to EVM data and promptly taking corrective action with your program’s cost and schedule performance often leads to poor outcomes.

Observation #5: It Takes More Energy To Be Poor At EVM Than To Be Expert

Returning to the earlier golf analogy, professional golfers make very difficult shots appear easy. I played in one pro/am tournament years ago. The pro I was teamed with took me to the range hours before our tee time. He asked me how many balls I hit before each round. I told him sometimes none and sometimes 50. He hit 1,000 balls before our round. When we finished our round, he was ready for another 18 holes. I was not. Both of us “complied” with the rules of golf. His score was significantly lower than mine. His game was effortless and produced a below par score. My game was labored and produced a poor result.

And so it is with EVM or any other process. The better you are at a skill, the easier it becomes. Experts consume far fewer calories at their craft than ambivalent amateurs.

Right Goal Post; Efficiently Expert At EVM

The polar opposite of a recalcitrant strategy to EVM is a strategy to become “efficiently expert.” As I mentioned earlier, I joined a company that attempted to sustain a recalcitrant EVM strategy. Their recalcitrant EVM strategy led to de-certification, large dollar withholdings, and significant damage to their corporate reputation.

After the most ardent EVM recalcitrants in this company “sought employment elsewhere,” a new strategy was adopted. This company embraced a strategy to become “best-in-class” as expert practitioners of EVM. This company’s goal was EVM perfection. EVM perfection is an impossible ambition, but wiser than “mere compliance.” And as with the PGA tour golf pro, EVM became nearly effortless.

Which EVM strategy will your company choose?


Robert “Too Tall” Kenney
H&A Associate

Earned Value Management: How Much Is Enough? Read Post »

Assessing Schedule Risk Using Deltek’s Acumen Risk 6.1 | Part 1 of 2

, , , , , , , , , , ,

Why Perform Schedule Risk Assessments? EVMS and Agile implementations within the same company or on the same project.

Before a project is ready to be baselined, a typical question the customer asks the project manager is, “How confident are you that the project will finish on time?”

This is a more difficult question than you might think.  In competitive environments, guessing is not an option.  The probability of success on a project must be quantified.  The risks that impact the odds for success must also be quantified.  If the risk is managed, the probability of completing the project on time and under budget is improved.

Customers are not blind to the importance of risk management.  This is evidenced by recent changes in government contracting requirements that call for formal risk assessments of project schedules.  Even if risk management were not a contractual requirement, it would be irresponsible for any project manager to ignore the need for risk management and proceed without identifying and assessing the project’s risks.

Schedule risk exists in every project.  This risk can be quantified, analyzed, and mitigated, or it can be ignored.  However, ignoring schedule risk does not make it go away.  Fortunately, there are advanced software tools, such as Deltek’s Acumen Risk, that can help model the expected impacts of risk in the schedule. Then, the answer to “how confident are you that the project will finish on time?” can be answered with quantifiable information.

In the following sections, a few of the foundational elements of performing a schedule risk assessment (SRA) using Acumen Risk 6.1 will be discussed.  The software was designed with the understanding that not everyone is an expert in schedule risk analysis.  The software provides beginners with an easy to follow path to perform in-depth schedule risk analysis as well as advanced features for experienced risk experts.

Along with quick start guides and help documentation, the menu structure is laid out like a schedule maturity timeline.  From left to right, the menu selections take one from the start-up steps of importing the schedule, to analyzing the schedule, assessing schedule risk, accelerating the schedule, and advanced customization features.

Deltek_Acumen-Top-Level_MenusDeltek Acumen – Top-Level Menus


Schedule Health Diagnostics

Before delving into schedule risk assessments, let’s take one minor detour from risk into schedule diagnostics.

Would you trust a broken watch to tell you the correct time?  The same goes for a schedule risk assessment.  A broken schedule network cannot be trusted to yield reliable, and therefore actionable, SRA results.

The National Defense Industrial Association (NDIA) Integrated Program Management Division (IPMD) Planning & Scheduling Excellence Guide (PASEG), is widely regarded as one of the premier references on scheduling best practices.  The PASEG was created by a joint team of both government and industry scheduling experts, thus it has no particular point of view to promote or defend.  One of the scheduling best practices the PASEG discusses is that the integrated master schedule (IMS) should be validated before any SRA is performed.  “Validated” means that the tasks, logic, durations, constraints, and lags in the IMS should be analyzed and corrected as necessary.

Acumen Fuse provides a complete set of schedule diagnostics.  When I first clicked on the “Diagnostics” tab, I saw an initial set of metrics.

EVMS: Acumen Fuse Schedule diagnostics

Each one of these metrics was applied to the project’s timeline that which makes it easy to see both where and when the issues occur.  What I did not notice at first was that these metrics were just one subset; I was only looking at the “Schedule Quality” subset of the diagnostics.  There were similar subsets in the areas of Logic, Duration, Constraints, Float, and the DCMA 14-point Schedule Assessment, just to name a few.  All of these diagnostic tests can be modified to reflect your company or customer’s standards.

Before leaving the topic of schedule health, there are a few words of caution.  No matter how useful a schedule analysis tool may be, there is no substitute for the task managers taking ownership of the IMS and ensuring that it is in good working order.  For example, analysis software can be used to check to determine if a task has a predecessor and a successor, but only someone familiar with the effort can determine if a task has the “correct” predecessor and successor.  Analysis software is becoming more and more sophisticated, but people still control the success or failure of the project.

Duration Uncertainty

Once a sound schedule has been developed, the next foundational elements of an SRA are the duration uncertainty estimates.  There are two widely accepted methods of assigning duration uncertainty.

The preferred and more precise method is to obtain three-point duration estimates (best case, worst case, and most likely) from the task owners.  At a minimum, this should be performed on all critical and near-critical tasks (and driving and near-driving tasks supporting significant events).  For larger schedule networks, it may not be reasonable to gather this type of information for every task.  If custom three-point estimates are not available, templated duration uncertainty could be applied based on the type of work, the task owner, historical performance, or any other applicable task characteristic.

Acumen Risk handles both methods very easily.  Custom three-point estimates can be entered for each task in days (or hours), or as a percentage of the current remaining duration of the task.  Standard duration uncertainty templates are easily applied to a task by selecting the appropriate risk level on the calibration bar.  To streamline the process, by setting the calibration at any summary level, the uncertainty template is cascaded down to all the “children” tasks.

Description. Calibration.

Risk Events

One thing traditional Critical Path Method (CPM) networks do poorly is model unexpected results.  For example, if there is a 90% success rate on fatigue testing, the IMS will generally be constructed to assume the test will be successful, with no disruption to downstream tasks.

EVMS: Critical Path Method

But what happens if the test fails?  While unlikely, there is still a very real possibility that the results will be unfavorable.  If the test does return unfavorable results, there will likely be a significant delay while re-work is performed in the areas of design, build and test.  A traditional CPM network can model a successful test or an unsuccessful test, but not both.  This is not a problem with a schedule risk assessment.  Information from the project’s risk register can be used to model the likelihood of a test failure, as well as the consequence, or delay to downstream tasks resulting from that failure.

EVMS: CPM Risk Events Consequence

Is this an acceptable risk?  An SRA can quantify the risk and provide information on the likelihood of successful deliveries.  Acumen does not stop there though.  One of its newest features is to organize and track all risk events within its built-in risk register, as well as to track the steps being taken to help mitigate that risk.  Or, if your organization already maintains an external risk register in Excel, it can be imported into Acumen to eliminate the duplicate tracking of risk events.  Whether the risk register is imported from Excel or built from scratch within Acumen, a single risk event can then be mapped to one or more activities, or a single activity can be associated with one or more risk events.

EVMS: risk registers 


Simulation ProcessEVMS: Simulation Process

A typical SRA uses Monte Carlo techniques to simulate hundreds or thousands of potential project outcomes using the risks and uncertainties that have been supplied.

For most users, simply accepting the default settings and pushing the “Run Risk Analysis” button would be sufficient.  But if terms like “Convergence”, “Correlation Coefficient”, “Central Limits Theorem” and “Seed Value” are part of your normal working environment, Acumen provides a variety of settings that can be customized to tune the SRA to best model your project.

No matter which approach you take, the Acumen toolset provides a quick and easy simulation process.


What to Expect in Part 2

Part 2 of this blog will delve into the interpretation of SRA results.


Yancy Qualls, PSP

Engagement Director, Schedule Subject Matter Expert (SME)

Humphreys & Associates, Inc.

Assessing Schedule Risk Using Deltek’s Acumen Risk 6.1 | Part 1 of 2 Read Post »

Clarification on the New Department of Defense Earned Value Management System EVMS Thresholds | DOD & DPAP

, , , , , , , , , , , , , , , ,

New Department of Defense Earned Value Management System (EVMS) ThresholdsOn September 28, 2015, the Defense Procurement and Acquisition Policy Directorate (<abbr=”Defense Procurement and Acquisition Policy Directorate”>DPAP) released a memorandum entitled “Class Deviation – Earned Value Management System Threshold”. In this memo the DoD changed the threshold for <abbr=”Earned Value Management System”>EVMS application to $100 million for compliance with EIA-748 for cost or incentive contracts and subcontracts. That same memorandum stated that no EVMS surveillance activities will be routinely conducted by the Defense Contract Management Agency (<abbr=”Defense Contract Management Agency”>DCMA) on contracts or subcontracts between $20 million to $100 million. As attachments to this memorandum, there was a reissuance of the Notice of Earned Value Management System <abbr=”Department of Defense Federal Acquisition Regulations”>DFARs clause (252.234-7001) and the Earned Value Management Systems DFARs clause (252.234-7002), with both reflecting the new $100 million threshold.In response to this guidance, a series of questions from both contractors and other government personnel were submitted to Shane Olsen of the DCMA EVM Implementation Division (<abbr=”EVM Implementation Division”>EVMID). Below are the salient points from this communication:

  • There will be no EVMS surveillance of DFARs contracts under $100 million. Contracts without the DFARs clause, such as those under other agencies using the FAR EVM clause, will continue surveillance under their current thresholds.
  • The $100 million threshold is determined on the larger of the contract’s Ceiling Price or Target Price; as reported on the Integrated Program Management Report (IPMR) or Contract Performance Report (CPR) Format 1.
  • The threshold is based on the Contract Value including fee (at Price) as noted above. If there is an approved Over Target Baseline (OTB) which increases the Total Allocated Budget (TAB), this cannot push a contract over the threshold.
  • The new thresholds not only apply to subcontracts, but also Inter-organizational work orders with an EVMS flow-down.
  • Regardless of the circumstances, the DCMA will not conduct surveillance on contracts less than $100 million. However, if there are Earned Value issues that the buying command or other parties believe need to be reviewed, then the DCMA may conduct a Review for Cause (RFC) of the system against potentially affected guidelines.
  • The DCMA Operations EVM Implementation Division (EVMID) will not be conducting Compliance Reviews in FY-2016 unless there is an “emergent need”.
  • If a site is selected for a Compliance Review, only contracts greater than $100 million would be in the initial scope of the Implementation Review (IR). However, if an issue is discovered that requires the team to “open the aperture”, other contracts are not precluded.

The DCMA is still working on a response to the following questions:

  • How do I handle a contract that is currently below $100 million but has options that, in aggregate, would exceed $100 million?
  • How is the contract value determined on:
    • Indefinite Delivery/Indefinite Quantity (ID/IQ) Contracts
    • Non-ID/IQ with Multiple CLIN-Level or Task Order reports?

This blog will be updated and reposted as answers to these questions are given.

Clarification on the New Department of Defense Earned Value Management System EVMS Thresholds | DOD & DPAP Read Post »

Earned Value Management Implementation Guide (EVMIG) Rescinded

, , , , , , , ,

Earned Value Management Implementation Guide (EVMIG) Rescinded | DFARSThe DoD EVM Implementation Guide (EVMIG, Oct 2006) was rescinded on September 15, 2015 by the Office of Performance Assessments and Root Cause Analysis (PARCA). The EVMIG had provided guidance for understanding Earned Value Management System (EVMS) concepts; detailed procedures for implementing the EIA-748 EVMS Standard, Earned Value Management Systems (EVMS), on government contracts; tailoring guidance for EVMS application and reporting; and post award procedures. Most of the details contained in the EVMIG are also available in other, more recent, publications and the EVMIG is replaced with these other references. EVM System information can be found in the DoD EVM System Interpretation Guide (EVMSIG) which provides overarching DoD interpretation of the 32 EIA-748 EVMS guidelines. Additional information can be found in multiple Defense Contract Management Agency (DCMA) compliance instruction documents.

PARCA identified the following references to replace the contents and guidance found in the EVMIG:

EVM Concepts and Guidelines
EVM Concepts TBD EVM Analysis Guide
Defense Acquisition University (DAU) EVM Community of Practice
PARCA EVM Website
EVM System (EVMS) Concepts EVMSIG
DCMA Surveillance Guide


Procedures For Government Use of EVM
Organizational Roles and Responsibilities TBD EVM Application Guide
PARCA EVM Website
Defense Acquisition Guide (DAG)
WBS Development and Use MIL-STD-881C
TBD EVM Application Guide
EVM/EVMS Policy and Application TBD EVM Application Guide
PARCA EVM Website
Cost and Schedule Reporting Integrated Program Management Report (IPMR) Data Item Description (DID) and IPMR Guide
TBD EVM Application Guide
EVMS System Compliance EVMSIG
DCMA Surveillance Guide
Integrated Baseline Review (IBR) Program Manager’s Guide to the Integrated Baseline Review (IBR)
TBD EVM Application Guide
Reprogramming Formal Reprogramming Over Target Baseline (OTB)/Over Target Schedule (OTS) Guide
EVMSIG
Training Defense Acquisition University Website
PARCA EVM Website

Earned Value Management Implementation Guide (EVMIG) Rescinded Read Post »

Guidelines for Schedule Displays

, , ,

EVMS & SDG: Schedules Display Guidelines for Organized Diplays and Earned Value Management

An Organized Approach to Improving Schedule Displays

Paul F. Bolinger 7/1/2014


This paper was originally published in the College of Performance Management’s Measurable News, third quarter 2014.

This paper establishes a set of guidelines to improve the display of schedules.

Research into human perception has brought an understanding of the ways that information display can be improved to speed up recognition and provide clarity. The guidelines presented here focus only on schedule information displays and are based on research by authors Colin Ware and Stephen Few [reference]. An example schedule display is developed as part of the paper to help the reader understand the application of the guidelines.The goal of displaying information is to aid the thinking of the reader. Research by Ware and Few informs us that there is some “pre-attentiveperception [reference] processed by the eye-brain combination. This is subconscious perception. The faster this front-end perception is accomplished, the faster overall perception and then cognition can be accomplished. In other words, the faster the reader can start to think about the meaning of the schedule. If the display is set up so that the reader just “gets it” without having to go piece by piece through the details, then the reader can move quickly on to their thought processes about the schedule. This paper is part of the effort to develop and disseminate the practice of building better top level executive type summary schedules for major projects.

Too often, large amounts of time and effort are put into project planning and scheduling only to be unavailable for, or hidden from, general usage by the obscurity of the systems used and the lack of neat clean ways to provide quality graphical schedule information at the project summary level. There are already tools available to build high impact top level schedules linked to the detailed networks below; now we have guidelines to help us use those tools to make our schedule displays even better.

The Schedules Display Guidelines (SDG)

In this paper, we will look at some defined guidelines and examples of what should be best practices in displaying schedules. Each schedule display guideline [SDG] has been derived from underlying research into human perception and processing of visual information. Colin Ware & Stephen Few have written very important works about information display, and Ware has published a set of guidelines on display of information in general. This paper adopts the guideline approach Ware used effectively, and specifically applies those guidelines to the display of schedules.

Each schedule display guideline will be stated, explained, and supported with an example. The assumption is that these schedules rest upon a disciplined lower level set of high quality schedules that meet the generally accepted scheduling guidelines (GASP). We are focused on the display of schedule information, not on the scheduling techniques and measures.

Guidelines and Supporting Arguments

[SDG 1.0] Identify the intended viewers of the schedule and prepare the display accordingly. Each audience can have a different level of interest in a project or program schedule. The right display approach for one audience can easily be totally wrong for another. For top level schedules, the display should present summary material relevant to the needs of the audience.

Some examples of target audiences are:

  1. Customers – who are interested in understanding the project from their point of view; when do they get what they ordered and what is their involvement.
  2. Company executives – who are interested in understanding the project and having a tool (the schedule) to use to inform others about the project.
  3. Project Team – who are interested in having a useable and understandable road map they can refer to as they proceed along the path to the goal.

The example provided later in this paper will be for customer executives intended to help them to follow progress and to explain the project to others. These executives want a one page overview schedule linked up from the detailed electronic schedules that they can confidently use to brief others on their project.

[SDG 2.0] Identify the environment; what is it you are going to describe in your schedule. Questions you must resolve before you make key decisions about the display are; will you be dealing with multiple projects, a single project, a single project with multiple goals, a single project with multiple high-level players like team mates or subcontractors, multiple phases of a project, a short period or a long period?

The example provided later in this paper is a single project for a U.S. Department of Defense customer. It will span multiple years and include design, fabrication, assembly, testing and support efforts to document the system. This is not a real project but represents the type of challenges found in real projects.

[SDG 3.0] Understand the project you are going to display. What is unique about the project? What message needs to be given to help the viewer understand the project? Remember that important details are obscured in the network centric scheduling software; the summary level schedule is the place where crucial components can be highlighted and emphasized.

The example project provided later in this paper is one in which a shipboard fire control system, consisting of hardware and software components, will be upgraded to meet new threats. Running parallel to this effort, the target drone fleet will be upgraded to be able to simulate the new threats. The shipboard modifications and the upgraded drones will be performed by two major sets of suppliers. The two parts of the project must come together for live fire testing. What should be emphasized is the parallel development of the shipboard system with the modifications to the target drones under the DoD project life cycle, with its various reviews and customer participation coming together at the goal.

[SDG 4.0] Design the type of schedule based on the audience, environment, and specific uniqueness of the project to provide the message you have. A comprehensive high level project roadmap might be just the thing for a schedule to be used with the customer or company executives, while a birds-on-a-wire type schedule might be better for combining multiple projects that must be shown together. A phased type schedule would work best on a multi-phased project. For the project team, the schedule should focus on their particular challenges. Each of those choices yields a different looking display.

The example will be a comprehensive high level project roadmap that includes the two major efforts, along with the supportability tasks needed to make an entire project. Because it is a single project, the use of birds-on-a-wire, phased, or other multi-project orientations have been discarded in favor of a road map approach. The road map is the highest level summary, but is intended to cover the entire project, start to finish, on a single page no larger than 11×17. To meet this challenge the display software will be used to “hand pack” the plan onto the single page before it is linked to the underlying network schedules.

[SDG 5.0] Select the background and frame to best fit the environment for the schedule. How the display is framed and subdivided significantly impact on how it is viewed. Do you want a plain blank background or do you want to subdivide the background in any way? Should your schedule have horizontal swim lanes to focus on sequential related work? Do vertical lines help you make your point? What calendar display should you use? Should you have a legend; do you need one?

Background color selection must be done in coordination with the color scheme for the symbols so that the proper amount of contrast can be established to help let the symbols stand out on the background. The correct background color will enhance the readability and impact of the display.

Because this example is a U.S. Navy project, colors in the blue and gold realm will be used in the background. In this case, swim lanes would make it more difficult to portray the two major efforts of the project coming together since swim lanes tend to keep elements separate. Because the project is a multi-year, vertical drop lines for the years will be used to help the viewer see the plan unfold across them. The background is a light color that recedes into the frame of the calendar. The calendar shows three levels: year, quarter, and month for clarity.

Milestones Professional 2012 Version | Schedules Display Guidelines (SDG) example #1

All graphic examples in this paper were produced using Milestones Professional 2012 Version.

[SDG 6.0] Group the display to best tell the story of the project, emphasizing the project flow from start to the various goals. Grouping is one of the key decisions in building the display. This is best done when the groups are natural or logical. The groups can be vertical groups related to timing like phases, horizontal groups of related types of work, groups by performer or supplier, or done to emphasize some other important grouping. If a project has a single goal, the waterfall top-to-bottom and left-to-right approach might be best. If the project has more than one goal, you should evaluate if the work can be grouped to show those various thrust or interest areas? If the project has some major subprojects or major players, would those factors lead you to a specific grouping set of criteria?

In this example two major groups will be built to show the shipboard and the drone efforts as groups coming together for the goal. A third group will be put at the bottom to contain miscellaneous work.

Milestones Professional 2012 Version | Schedules Display Guidelines (SDG) example #2

[SDG 7.0] Select and use as small a set of standard symbols as you need to cover the environment. Symbols should be standardized across the schedules developed by an organization or company. Once a usable set of symbols is employed and used rigorously, the level of ease of perception, recognition, and interpretation will improve and the speed of comprehension will grow.

The idea of standardizing is a way to help us move more quickly from perception to cognition. After all, we are using the schedule information so that we can think about the schedule, the project, the issues, the outcomes, and so on. That is cognition or analysis. The schedule is a tool to help us with our cognition so we don’t want the schedule itself, the way it is presented, to get in the way. On the contrary, we want to have the best way to quickly get the message to the thinking part of our brains.

[SDG 7.1] Landmark milestones should be unique in shape and color as well as position. Landmark symbols are important symbols that would show on every page or would show on the prime contractor and subcontractor schedules to anchor the various versions in the eyes and minds of the readers.

Because this is a U.S. Navy project the shape of a ship has been used as the landmark symbol for top level milestone. The other symbols show milestones as triangles so that they come to a point at a specific date. Other bars are used to show durations and durations with special attributes. These special task bars will help the reader spot uniqueness in the plan. Deliveries are shown as a unique diamond shape to help the eye find them on the plan.

Milestones Professional 2012 Version | Schedules Display Guidelines (SDG) example #3

[SDG 8.0] Use a few basic colors to differentiate and highlight your schedule display; red, green, yellow and blue are good choices for basic presentations. Colors are easily perceived if selected carefully. The research indicates the colors best suited to display. Colors can be a negative factor if they have emotional content.

In this example the same symbols will be kept but colors will be modified for emphasis. The shipboard tasks will be one color scheme while the drone tasks will be another. Deliveries will be a consistent green diamond since green provides the idea of “go”. Ancillary tasks will default to the shipboard scheme rather than having a third color scheme which would make the plan less readable. Where the two efforts come together, the final joint effort will be highlighted by color.

Milestones Professional 2012 Version | Schedules Display Guidelines (SDG) example #4

[SDG 9.0] Prioritize the display to enhance the story. Priority can be established by size, color, sequence or a combination of techniques. Priority in schedule display leads the viewer through the schedule so it is an important concept and an important attribute of the display.

Place important landmark milestones at the top. Prioritize your groups in logical order according to the specific project goals. In this example, the shipboard systems will be positioned just below the landmark milestones and will waterfall down to the right to the goal. This implies that the shipboard system work “leads off” and is of high importance. The drone systems will flow upward from the bottom left to the goal, The “Vee” shape will emphasize the supportive nature of this effort and how the two major thrusts come together at the goal.

Milestones Professional 2012 Version | Schedules Display Guidelines (SDG) example #5

[SDG 10.0] Add comments to the schedule at important decision points, important transition points, and to enhance comprehension where that is needed. Movement from one phase to another is an important transition that you could explain. The sequential transition from design, to build, to testing marks major changes in the type of work on a project; these points would be logical places for comments. Decisions that dramatically affect the project should be mapped onto the schedules and highlighted with comments. For example, the decision whether or not to authorize additional product builds, or other follow-on efforts, are important points in a plan.

[SDG 11.0] Examine the display and analyze it according to its adherence to the guidelines as well as its impact. Does it get the job done? Modify as needed to complete the display. Try it out on people to see if they can spot weaknesses or suggest improvements.

Here is the final example of the plan. Review and analyze this display in terms of its adherence to the guidelines and how far it goes in providing the top level executive summary schedule needed for the project.

Milestones Professional 2012 Version | Schedules Display Guidelines (SDG) example #6

The analysis of the final overall example shows the elements added that correspond with the schedule display guidelines.

Milestones Professional 2012 Version | Schedules Display Guidelines (SDG) example #6 details

Paul F. Bolinger is an Engagement Director with Humphreys & Associates consulting in project management with a specific emphasis on project scheduling. His experience with project scheduling tools like Primavera and Microsoft Project has proven there is a need for high level well-constructed schedule displays. He has consulted on many projects including electronics, aerospace, nuclear power, shipbuilding, and construction.

Guidelines for Schedule Displays Read Post »

Scroll to Top