Scheduling

Along the IMS Time-Now Line

, , , , , , , , , , , ,

Arrows moving to the right.Recently one of our consultants was instructing a session on the Integrated Master Schedule (IMS) with a group of project personnel from one of our larger clients. The group was a mixture of beginners with no real experience in schedules and some much more experienced practitioners; some with more than 10 years of experience. The mixture made it somewhat difficult, but it also made for some interesting discussions that might have been missed in a more homogenous group. One of those things was the usefulness or importance of the “time-now” line.

When the group was asked about the importance of the time-now line and what information could be easily gained from a look at the line, there was silence. The beginners did not have a clue but also none of the experienced people had any response. What should have been a short discussion with just one “slide” as a visual, turned out to be a longer and more informative session on this topic.

The time-now line has different names in different software tools but it refers to the data date, or status date, of the schedule. That also would be the first day of the remainder of the schedule. When a scheduler sorts tasks by date, the time-now line runs down the screen and forms a highly useful visible reference.

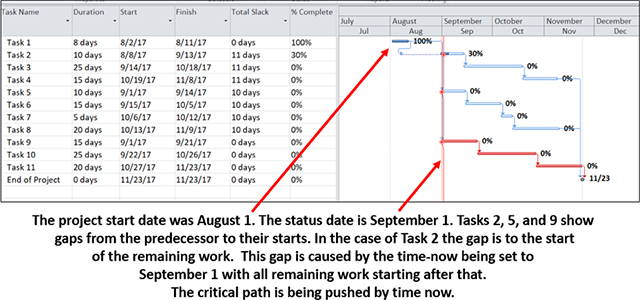
In the small example below [see Figure 1], you can see the time-now line and visually assess the situation. Time-now is shown by a vertical line at the beginning of September, so all remaining effort has been scheduled to after that date. In other words, no work can be forecasted in the past. A walk down the line shows Task 1 has both started and completed. Task 2 started but has not completed. In fact, the remaining work in Task 2 has been pushed out by the time-now line. The start of Tasks 5 and 9 are also being pushed out by the time-now line. In most real project schedules, filters and other techniques may be needed to isolate information like this; but in our small example, we can simply “eyeball” the time-now line and see valuable information. Task 9 starts the critical path shown in red tasks.


The project start date was August 1. The status date is September 1. Tasks 2, 5, and 9 show gaps from the predecessor to their starts. in the case of Task 2 the cap is to the start of the remaining work. This gap is caused by the time-now being set to September 1 with all remaining work starting after that. The critical path is being pushed by time now.Figure 1


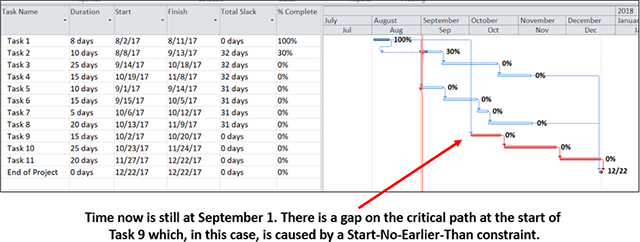
A slightly different setup for that same small example [see Figure 2] shows something interesting. The time-now line is still at the beginning of September. But now there is a gap between time-now and work on the critical path. This is an unusual situation and should be investigated for the root cause. It is possible this is an accurate portrayal of the situation, but regardless of the cause, it must be verified and explained.


Time now is still at September 1. There is a gap on the critical path at the start of Task 9 which, in this case, is caused by a Start-No-Earlier-Than constraint.Figure 2


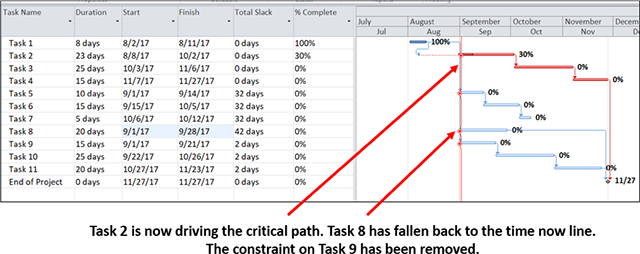
In yet one more variation [see Figure 3], we see that a broken link results in Task 8 ending up on the time-now line. A task without a predecessor will be rescheduled to start at the earliest possible time (if the task is set to be “As Soon As Possible”). And the earliest possible time is the time-now line; the beginning of September. Just as broken things fall to the floor in real life, “broken things” fall to the time-now line in a schedule. Un-started work can land there. Un-finished work can land there. And un-linked work can land there.

It is further possible to see that Task 2 has had an increase in the remaining duration that has driven it onto the critical path. Task 2 at this moment is the most important task on the entire project. A slip to Task 2 will drive out the end date for the entire project. One question that needs answering is what is holding up Task 2?

If the display had been sorted by increasing total float/slack and the usual cascade by date, then the critical path would be starting at the upper left-hand corner; like the critical path in this example. The action on the project is almost always on the time-now line and the most important action, when sorted as described, will be at the upper left-hand corner.


Task 2 is now driving the critical path. Task 8 has fallen back to the time now line. The constraint on Task 9 has been removed.Figure 3


So, a walk down the time-now line can help us see the critical path action, find broken parts of the schedule, and locate unusual circumstances that need our attention. Our recommendation is to look at the time-now line any time there is data being changed in the IMS. This will help you catch issues early and keep the schedule cleaner.

Along the IMS Time-Now Line Read Post »

Assessing Schedule Risk Using Deltek’s Acumen Risk 6.1 | Part 2 of 2

, , , , , , ,

Schedule Risk Analysis Results

Agile assessments identify, evaluate and assigns risk to projects. Schedule risk analysis results are predominantly communicated in two important sets of intelligence.

Risk Exposure Chart

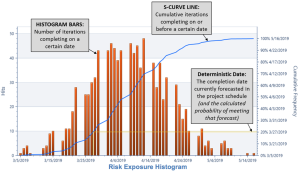
The first, and higher level output, is the Risk Exposure Chart. This chart depicts the level of confidence that the project scope, as modeled in the IMS, can be completed by a certain date. The chart commonly includes a histogram depicting the number of project simulations that are being completed on each specific date, and a curve that shows the cumulative values across time up to a 100% confidence level. Using the Deltek Acumen Risk Exposure histogram, the baseline finish, forecasted finish or any other desired date can be examined, as well as determination of the probability of achieving that date based on the number of simulations completing on or before that point in time.

EVMS: Risk Exposure Chart

Now that you know there are problems, what are you going to do about them? On which tasks should mitigation attempts be made? Is the current critical path comprised of the riskiest tasks? This is where the second area of intelligence output comes into play.

Tornado Chart

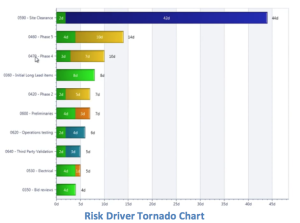
Acumen produces a list of “risk drivers” in the form of a Tornado Chart. These are the tasks that are expected to have the greatest influence on risk in the schedule. Put another way, this report highlights the tasks that, if they could be executed in less time, would have the greatest impact on increasing the likelihood of an on-time project completion. Acumen’s rendition of the Tornado Chart also displays the amount of the risk that can be attributed to duration uncertainty, logic, or any of the risk events. New to Acumen 6.1 is the ability to easily display this information in either days or hours.

EVMS: Risk Driver Tornado

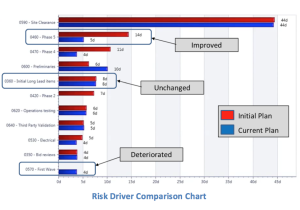
But how does one know if all of the time and effort that has been spent mitigating risk is working? Acumen can help here too. The initial (unmitigated) plan can be compared to the current (mitigated) plan. Has risk been reduced as expected? Or, because of mitigation efforts in one area, has risk increased in other areas (a.k.a. collateral damage)? Stacking the results within the Tornado Chart, it can quickly be seen which risk drivers improved, were unaffected, or deteriorated.

EVMS: Risk Driver Comparison

Parting Thoughts

The goal of any SRA tool is to identify and quantify schedule risk to a project so that action can be taken to improve project execution. Used properly, Acumen Risk does exactly that. With over 20 years as a full-time scheduler, I have dealt with thousands of project schedules and many, many analysis tools. From what I have seen so far, Acumen is an evolutionary step in performing schedule risk assessments. It offers beginners an easy path to perform in-depth schedule analysis with advanced features for more experienced users to help further refine the accuracy of the results. I encourage you to register for a free trial version and test it out for yourself.

Yancy Qualls, PSP

Engagement Director, Schedule Subject Matter Expert

Humphreys & Associates, Inc.

Assessing Schedule Risk Using Deltek’s Acumen Risk 6.1 | Part 2 of 2 Read Post »

Assessing Schedule Risk Using Deltek’s Acumen Risk 6.1 | Part 1 of 2

, , , , , , , , , , ,

Why Perform Schedule Risk Assessments? EVMS and Agile implementations within the same company or on the same project.

Before a project is ready to be baselined, a typical question the customer asks the project manager is, “How confident are you that the project will finish on time?”

This is a more difficult question than you might think.  In competitive environments, guessing is not an option.  The probability of success on a project must be quantified.  The risks that impact the odds for success must also be quantified.  If the risk is managed, the probability of completing the project on time and under budget is improved.

Customers are not blind to the importance of risk management.  This is evidenced by recent changes in government contracting requirements that call for formal risk assessments of project schedules.  Even if risk management were not a contractual requirement, it would be irresponsible for any project manager to ignore the need for risk management and proceed without identifying and assessing the project’s risks.

Schedule risk exists in every project.  This risk can be quantified, analyzed, and mitigated, or it can be ignored.  However, ignoring schedule risk does not make it go away.  Fortunately, there are advanced software tools, such as Deltek’s Acumen Risk, that can help model the expected impacts of risk in the schedule. Then, the answer to “how confident are you that the project will finish on time?” can be answered with quantifiable information.

In the following sections, a few of the foundational elements of performing a schedule risk assessment (SRA) using Acumen Risk 6.1 will be discussed.  The software was designed with the understanding that not everyone is an expert in schedule risk analysis.  The software provides beginners with an easy to follow path to perform in-depth schedule risk analysis as well as advanced features for experienced risk experts.

Along with quick start guides and help documentation, the menu structure is laid out like a schedule maturity timeline.  From left to right, the menu selections take one from the start-up steps of importing the schedule, to analyzing the schedule, assessing schedule risk, accelerating the schedule, and advanced customization features.

Deltek_Acumen-Top-Level_MenusDeltek Acumen – Top-Level Menus


Schedule Health Diagnostics

Before delving into schedule risk assessments, let’s take one minor detour from risk into schedule diagnostics.

Would you trust a broken watch to tell you the correct time?  The same goes for a schedule risk assessment.  A broken schedule network cannot be trusted to yield reliable, and therefore actionable, SRA results.

The National Defense Industrial Association (NDIA) Integrated Program Management Division (IPMD) Planning & Scheduling Excellence Guide (PASEG), is widely regarded as one of the premier references on scheduling best practices.  The PASEG was created by a joint team of both government and industry scheduling experts, thus it has no particular point of view to promote or defend.  One of the scheduling best practices the PASEG discusses is that the integrated master schedule (IMS) should be validated before any SRA is performed.  “Validated” means that the tasks, logic, durations, constraints, and lags in the IMS should be analyzed and corrected as necessary.

Acumen Fuse provides a complete set of schedule diagnostics.  When I first clicked on the “Diagnostics” tab, I saw an initial set of metrics.

EVMS: Acumen Fuse Schedule diagnostics

Each one of these metrics was applied to the project’s timeline that which makes it easy to see both where and when the issues occur.  What I did not notice at first was that these metrics were just one subset; I was only looking at the “Schedule Quality” subset of the diagnostics.  There were similar subsets in the areas of Logic, Duration, Constraints, Float, and the DCMA 14-point Schedule Assessment, just to name a few.  All of these diagnostic tests can be modified to reflect your company or customer’s standards.

Before leaving the topic of schedule health, there are a few words of caution.  No matter how useful a schedule analysis tool may be, there is no substitute for the task managers taking ownership of the IMS and ensuring that it is in good working order.  For example, analysis software can be used to check to determine if a task has a predecessor and a successor, but only someone familiar with the effort can determine if a task has the “correct” predecessor and successor.  Analysis software is becoming more and more sophisticated, but people still control the success or failure of the project.

Duration Uncertainty

Once a sound schedule has been developed, the next foundational elements of an SRA are the duration uncertainty estimates.  There are two widely accepted methods of assigning duration uncertainty.

The preferred and more precise method is to obtain three-point duration estimates (best case, worst case, and most likely) from the task owners.  At a minimum, this should be performed on all critical and near-critical tasks (and driving and near-driving tasks supporting significant events).  For larger schedule networks, it may not be reasonable to gather this type of information for every task.  If custom three-point estimates are not available, templated duration uncertainty could be applied based on the type of work, the task owner, historical performance, or any other applicable task characteristic.

Acumen Risk handles both methods very easily.  Custom three-point estimates can be entered for each task in days (or hours), or as a percentage of the current remaining duration of the task.  Standard duration uncertainty templates are easily applied to a task by selecting the appropriate risk level on the calibration bar.  To streamline the process, by setting the calibration at any summary level, the uncertainty template is cascaded down to all the “children” tasks.

Description. Calibration.

Risk Events

One thing traditional Critical Path Method (CPM) networks do poorly is model unexpected results.  For example, if there is a 90% success rate on fatigue testing, the IMS will generally be constructed to assume the test will be successful, with no disruption to downstream tasks.

EVMS: Critical Path Method

But what happens if the test fails?  While unlikely, there is still a very real possibility that the results will be unfavorable.  If the test does return unfavorable results, there will likely be a significant delay while re-work is performed in the areas of design, build and test.  A traditional CPM network can model a successful test or an unsuccessful test, but not both.  This is not a problem with a schedule risk assessment.  Information from the project’s risk register can be used to model the likelihood of a test failure, as well as the consequence, or delay to downstream tasks resulting from that failure.

EVMS: CPM Risk Events Consequence

Is this an acceptable risk?  An SRA can quantify the risk and provide information on the likelihood of successful deliveries.  Acumen does not stop there though.  One of its newest features is to organize and track all risk events within its built-in risk register, as well as to track the steps being taken to help mitigate that risk.  Or, if your organization already maintains an external risk register in Excel, it can be imported into Acumen to eliminate the duplicate tracking of risk events.  Whether the risk register is imported from Excel or built from scratch within Acumen, a single risk event can then be mapped to one or more activities, or a single activity can be associated with one or more risk events.

EVMS: risk registers 


Simulation ProcessEVMS: Simulation Process

A typical SRA uses Monte Carlo techniques to simulate hundreds or thousands of potential project outcomes using the risks and uncertainties that have been supplied.

For most users, simply accepting the default settings and pushing the “Run Risk Analysis” button would be sufficient.  But if terms like “Convergence”, “Correlation Coefficient”, “Central Limits Theorem” and “Seed Value” are part of your normal working environment, Acumen provides a variety of settings that can be customized to tune the SRA to best model your project.

No matter which approach you take, the Acumen toolset provides a quick and easy simulation process.


What to Expect in Part 2

Part 2 of this blog will delve into the interpretation of SRA results.


Yancy Qualls, PSP

Engagement Director, Schedule Subject Matter Expert (SME)

Humphreys & Associates, Inc.

Assessing Schedule Risk Using Deltek’s Acumen Risk 6.1 | Part 1 of 2 Read Post »

Guidelines for Schedule Displays

, , ,

EVMS & SDG: Schedules Display Guidelines for Organized Diplays and Earned Value Management

An Organized Approach to Improving Schedule Displays

Paul F. Bolinger 7/1/2014


This paper was originally published in the College of Performance Management’s Measurable News, third quarter 2014.

This paper establishes a set of guidelines to improve the display of schedules.

Research into human perception has brought an understanding of the ways that information display can be improved to speed up recognition and provide clarity. The guidelines presented here focus only on schedule information displays and are based on research by authors Colin Ware and Stephen Few [reference]. An example schedule display is developed as part of the paper to help the reader understand the application of the guidelines.The goal of displaying information is to aid the thinking of the reader. Research by Ware and Few informs us that there is some “pre-attentiveperception [reference] processed by the eye-brain combination. This is subconscious perception. The faster this front-end perception is accomplished, the faster overall perception and then cognition can be accomplished. In other words, the faster the reader can start to think about the meaning of the schedule. If the display is set up so that the reader just “gets it” without having to go piece by piece through the details, then the reader can move quickly on to their thought processes about the schedule. This paper is part of the effort to develop and disseminate the practice of building better top level executive type summary schedules for major projects.

Too often, large amounts of time and effort are put into project planning and scheduling only to be unavailable for, or hidden from, general usage by the obscurity of the systems used and the lack of neat clean ways to provide quality graphical schedule information at the project summary level. There are already tools available to build high impact top level schedules linked to the detailed networks below; now we have guidelines to help us use those tools to make our schedule displays even better.

The Schedules Display Guidelines (SDG)

In this paper, we will look at some defined guidelines and examples of what should be best practices in displaying schedules. Each schedule display guideline [SDG] has been derived from underlying research into human perception and processing of visual information. Colin Ware & Stephen Few have written very important works about information display, and Ware has published a set of guidelines on display of information in general. This paper adopts the guideline approach Ware used effectively, and specifically applies those guidelines to the display of schedules.

Each schedule display guideline will be stated, explained, and supported with an example. The assumption is that these schedules rest upon a disciplined lower level set of high quality schedules that meet the generally accepted scheduling guidelines (GASP). We are focused on the display of schedule information, not on the scheduling techniques and measures.

Guidelines and Supporting Arguments

[SDG 1.0] Identify the intended viewers of the schedule and prepare the display accordingly. Each audience can have a different level of interest in a project or program schedule. The right display approach for one audience can easily be totally wrong for another. For top level schedules, the display should present summary material relevant to the needs of the audience.

Some examples of target audiences are:

  1. Customers – who are interested in understanding the project from their point of view; when do they get what they ordered and what is their involvement.
  2. Company executives – who are interested in understanding the project and having a tool (the schedule) to use to inform others about the project.
  3. Project Team – who are interested in having a useable and understandable road map they can refer to as they proceed along the path to the goal.

The example provided later in this paper will be for customer executives intended to help them to follow progress and to explain the project to others. These executives want a one page overview schedule linked up from the detailed electronic schedules that they can confidently use to brief others on their project.

[SDG 2.0] Identify the environment; what is it you are going to describe in your schedule. Questions you must resolve before you make key decisions about the display are; will you be dealing with multiple projects, a single project, a single project with multiple goals, a single project with multiple high-level players like team mates or subcontractors, multiple phases of a project, a short period or a long period?

The example provided later in this paper is a single project for a U.S. Department of Defense customer. It will span multiple years and include design, fabrication, assembly, testing and support efforts to document the system. This is not a real project but represents the type of challenges found in real projects.

[SDG 3.0] Understand the project you are going to display. What is unique about the project? What message needs to be given to help the viewer understand the project? Remember that important details are obscured in the network centric scheduling software; the summary level schedule is the place where crucial components can be highlighted and emphasized.

The example project provided later in this paper is one in which a shipboard fire control system, consisting of hardware and software components, will be upgraded to meet new threats. Running parallel to this effort, the target drone fleet will be upgraded to be able to simulate the new threats. The shipboard modifications and the upgraded drones will be performed by two major sets of suppliers. The two parts of the project must come together for live fire testing. What should be emphasized is the parallel development of the shipboard system with the modifications to the target drones under the DoD project life cycle, with its various reviews and customer participation coming together at the goal.

[SDG 4.0] Design the type of schedule based on the audience, environment, and specific uniqueness of the project to provide the message you have. A comprehensive high level project roadmap might be just the thing for a schedule to be used with the customer or company executives, while a birds-on-a-wire type schedule might be better for combining multiple projects that must be shown together. A phased type schedule would work best on a multi-phased project. For the project team, the schedule should focus on their particular challenges. Each of those choices yields a different looking display.

The example will be a comprehensive high level project roadmap that includes the two major efforts, along with the supportability tasks needed to make an entire project. Because it is a single project, the use of birds-on-a-wire, phased, or other multi-project orientations have been discarded in favor of a road map approach. The road map is the highest level summary, but is intended to cover the entire project, start to finish, on a single page no larger than 11×17. To meet this challenge the display software will be used to “hand pack” the plan onto the single page before it is linked to the underlying network schedules.

[SDG 5.0] Select the background and frame to best fit the environment for the schedule. How the display is framed and subdivided significantly impact on how it is viewed. Do you want a plain blank background or do you want to subdivide the background in any way? Should your schedule have horizontal swim lanes to focus on sequential related work? Do vertical lines help you make your point? What calendar display should you use? Should you have a legend; do you need one?

Background color selection must be done in coordination with the color scheme for the symbols so that the proper amount of contrast can be established to help let the symbols stand out on the background. The correct background color will enhance the readability and impact of the display.

Because this example is a U.S. Navy project, colors in the blue and gold realm will be used in the background. In this case, swim lanes would make it more difficult to portray the two major efforts of the project coming together since swim lanes tend to keep elements separate. Because the project is a multi-year, vertical drop lines for the years will be used to help the viewer see the plan unfold across them. The background is a light color that recedes into the frame of the calendar. The calendar shows three levels: year, quarter, and month for clarity.

Milestones Professional 2012 Version | Schedules Display Guidelines (SDG) example #1

All graphic examples in this paper were produced using Milestones Professional 2012 Version.

[SDG 6.0] Group the display to best tell the story of the project, emphasizing the project flow from start to the various goals. Grouping is one of the key decisions in building the display. This is best done when the groups are natural or logical. The groups can be vertical groups related to timing like phases, horizontal groups of related types of work, groups by performer or supplier, or done to emphasize some other important grouping. If a project has a single goal, the waterfall top-to-bottom and left-to-right approach might be best. If the project has more than one goal, you should evaluate if the work can be grouped to show those various thrust or interest areas? If the project has some major subprojects or major players, would those factors lead you to a specific grouping set of criteria?

In this example two major groups will be built to show the shipboard and the drone efforts as groups coming together for the goal. A third group will be put at the bottom to contain miscellaneous work.

Milestones Professional 2012 Version | Schedules Display Guidelines (SDG) example #2

[SDG 7.0] Select and use as small a set of standard symbols as you need to cover the environment. Symbols should be standardized across the schedules developed by an organization or company. Once a usable set of symbols is employed and used rigorously, the level of ease of perception, recognition, and interpretation will improve and the speed of comprehension will grow.

The idea of standardizing is a way to help us move more quickly from perception to cognition. After all, we are using the schedule information so that we can think about the schedule, the project, the issues, the outcomes, and so on. That is cognition or analysis. The schedule is a tool to help us with our cognition so we don’t want the schedule itself, the way it is presented, to get in the way. On the contrary, we want to have the best way to quickly get the message to the thinking part of our brains.

[SDG 7.1] Landmark milestones should be unique in shape and color as well as position. Landmark symbols are important symbols that would show on every page or would show on the prime contractor and subcontractor schedules to anchor the various versions in the eyes and minds of the readers.

Because this is a U.S. Navy project the shape of a ship has been used as the landmark symbol for top level milestone. The other symbols show milestones as triangles so that they come to a point at a specific date. Other bars are used to show durations and durations with special attributes. These special task bars will help the reader spot uniqueness in the plan. Deliveries are shown as a unique diamond shape to help the eye find them on the plan.

Milestones Professional 2012 Version | Schedules Display Guidelines (SDG) example #3

[SDG 8.0] Use a few basic colors to differentiate and highlight your schedule display; red, green, yellow and blue are good choices for basic presentations. Colors are easily perceived if selected carefully. The research indicates the colors best suited to display. Colors can be a negative factor if they have emotional content.

In this example the same symbols will be kept but colors will be modified for emphasis. The shipboard tasks will be one color scheme while the drone tasks will be another. Deliveries will be a consistent green diamond since green provides the idea of “go”. Ancillary tasks will default to the shipboard scheme rather than having a third color scheme which would make the plan less readable. Where the two efforts come together, the final joint effort will be highlighted by color.

Milestones Professional 2012 Version | Schedules Display Guidelines (SDG) example #4

[SDG 9.0] Prioritize the display to enhance the story. Priority can be established by size, color, sequence or a combination of techniques. Priority in schedule display leads the viewer through the schedule so it is an important concept and an important attribute of the display.

Place important landmark milestones at the top. Prioritize your groups in logical order according to the specific project goals. In this example, the shipboard systems will be positioned just below the landmark milestones and will waterfall down to the right to the goal. This implies that the shipboard system work “leads off” and is of high importance. The drone systems will flow upward from the bottom left to the goal, The “Vee” shape will emphasize the supportive nature of this effort and how the two major thrusts come together at the goal.

Milestones Professional 2012 Version | Schedules Display Guidelines (SDG) example #5

[SDG 10.0] Add comments to the schedule at important decision points, important transition points, and to enhance comprehension where that is needed. Movement from one phase to another is an important transition that you could explain. The sequential transition from design, to build, to testing marks major changes in the type of work on a project; these points would be logical places for comments. Decisions that dramatically affect the project should be mapped onto the schedules and highlighted with comments. For example, the decision whether or not to authorize additional product builds, or other follow-on efforts, are important points in a plan.

[SDG 11.0] Examine the display and analyze it according to its adherence to the guidelines as well as its impact. Does it get the job done? Modify as needed to complete the display. Try it out on people to see if they can spot weaknesses or suggest improvements.

Here is the final example of the plan. Review and analyze this display in terms of its adherence to the guidelines and how far it goes in providing the top level executive summary schedule needed for the project.

Milestones Professional 2012 Version | Schedules Display Guidelines (SDG) example #6

The analysis of the final overall example shows the elements added that correspond with the schedule display guidelines.

Milestones Professional 2012 Version | Schedules Display Guidelines (SDG) example #6 details

Paul F. Bolinger is an Engagement Director with Humphreys & Associates consulting in project management with a specific emphasis on project scheduling. His experience with project scheduling tools like Primavera and Microsoft Project has proven there is a need for high level well-constructed schedule displays. He has consulted on many projects including electronics, aerospace, nuclear power, shipbuilding, and construction.

Guidelines for Schedule Displays Read Post »

Schedule Health Metrics

What are Schedule Health Metrics?

Schedule Health Metrics by Humphreys & AssociatesAt the heart of every successful Earned Value Management System (EVMS) is a comprehensive Integrated Master Schedule (IMS) that aligns all discrete effort with a time-phased budget plan to complete the project.  As such, the IMS must be complete and accurate to provide the necessary information to other EVMS process groups and users.  The IMS may be a single file of information in an automated scheduling tool, or a set of files that also includes subcontractor schedules.

For any medium to large project, the IMS may contain thousands of activities and milestones interconnected with logical relationships and date constraints to portray the project plan.  Schedule Health Metrics provide insight into the IMS integrity and viability.

Why are Schedule Health Metrics important?

For a schedule to be useable, both as a standalone product and as a component of the EVMS, standards have been developed to reflect both general scheduling practices and contractual requirements.  Schedule Health Metrics contain checks designed to indicate potential IMS issues.  Each check has a tolerance established to help focus on particular areas of concern.  The individual metrics should not be considered as a pass or fail score, but should be used as a set of indicators to guide questions into specific areas of the IMS.

For example, if there is an unusually large number of tasks with high total float properties, a review of the logic in the IMS is warranted.  At the end of the analysis, if the Control Account Manager (CAM) responsible for the work, with the help of the Planner/Scheduler, can explain why the high float exists, then the issue is mute.  Metrics are simply a method to help isolate issues in a large amount of data.  In this example, the analysis will continue to depict issues with this CAM’s data, but those issues are not indicative of failure.

What are the standards?

From the beginning of automated scheduling systems in the 1980’s, attempts have been made to take advantage of the scheduling databases for the purpose of metrical analysis.  The maturity of scheduling software tools has provided better access to metrics in both open architecture databases and with export capabilities to tools such as Microsoft’s Excel and Access products. With the availability of the new tools, new analysis techniques were developed and implemented.

Several years ago, the Defense Contract Management Agency (DCMA) reviewed the various Schedule Health Metrics being used within the US Government and selected 14 tests they believed to be the best tests of an IMS.  Because they support a wide variety of customers from the DOD, NASA, and DOE, they have developed these checks with thresholds that should be common to all types of programs, but not specific or restrictive to a particular one. The thresholds help bring focus to the issues in the schedule under review.  With agreement between the customer, the DCMA and the contractor, they may be altered in some cases to reflect the unique nature of a project.

Unless otherwise indicated, the DCMA Health Metrics apply only to incomplete activities or tasks in the IMS, not milestones, with baseline durations of 1 day or longer. This set also excludes Level of Effort (LOE) and Summary tasks because they should not be driving the network.  The DCMA 14 point Schedule Health Metrics are:

1.  Missing Logic

The test: The percentage of incomplete activities that do not have a predecessor or successor.

The threshold: 5%.

For a schedule to function correctly, the tasks must be logically linked to produce a realistic mathematical model that sequences the work to be performed.

2.  Activities with Leads

The test: The percentage of relationships in the project with lags of negative 1 day or less.

The threshold: 0%.

The project schedule should flow in time from the beginning to the end.  Negative lags, or leads, are counter to that flow and can make it more difficult to analyze the Critical Path.  In many cases this may also indicate that the schedule does not contain a sufficient level of detail.

3.  Activities with Lags

The test: The percentage of incomplete activities that have schedule lags assigned to their relationships.

The threshold: 5%.

An excessive use of lags can distort an IMS and should be avoided.

4.  Relationship Types

The test: The percent of Finish to Start relationships to all relationships.

The threshold: 90%.

A project schedule should flow from the beginning of the program to the end.  Finish to Start (FS) relationships are the easiest and most natural flow of work in the IMS, with the occasional Start to Start (SS) and Finish to Finish (FF) relationship as required.  Start to Finish relationships should not be used because they represent a backward flow of time and can distort the IMS, as do the overuse of SS and FF relationships.

5.  Hard constraints

The test: The current definition includes any date constraint that effects both the forward and backward pass in the scheduling engine.  These include any date constraint that says ‘Must’ or ‘Mandatory’, ‘Start On’ or ‘Finish On’, and ‘Start’ or ‘Finish Not Later Than’ date constraints.

The threshold: 5%.

Hard constraints limit the flexibility of the IMS to produce reliable Driving Paths or a Program Critical Path.  Techniques using soft constraints and deadlines can allow the schedule to flow and identify more issues with float values.

6.  High Float

The test: Percentage of tasks with High Total Float values over 44 days.

The threshold: 5%.

A well-defined schedule should not have large numbers of tasks with high total float or slack values.  Schedules with this condition may have missing or incorrect logic, missing scope or other structural issues causing the high float condition.  The DCMA default threshold of 44 days was selected because it represents two months of effort.  Individual projects may wish to expand or contract that threshold based on the length of the project and the type of project being scheduled; however, any changes in thresholds should be coordinated with the customer first to confirm the viability of the alternate measurement.

7.  Negative Float

The test: The percentage of activities that have a total float or slack value of less than zero (0) days of float.

The threshold: 0%.

When a schedule contains tasks with negative float, it indicates that the project is not able to meet one or more of its delivery goals. This is an alarm requiring redress with a corrective action plan.  Please see the Negative Float blog for additional discussion.

8.  High Duration

The test: A percentage of tasks in the current planning period with baseline durations greater than 44 days.  This check excludes LOE, planning packages and summary level planning packages.

The threshold: 5%.

Near term tasks should be broken down to a sufficient level of detail to define the project work and delivery requirements.  These tasks should be shorter and more detailed since more is known about the immediate scope and schedule requirements and resource availabilities.  For tasks beyond the rolling wave period, longer duration tasks in planning packages are acceptable, as long as the IMS can still be used to accurately develop Driving Paths to Event Milestones and a Program Critical Path to the end of the project.

9.  Invalid Dates

The test: Percentage of tasks with actual start or finish dates beyond the Data Date, or without actual start or finish dates before the Data Date.

The threshold: 0%.

The check is designed to ensure activities are statused with respect to the Data Date in the IMS.  Claiming actual start or finish dates in the future are not acceptable from a scheduling perspective, but can also create distortions in the EVM System by erroneously claiming Earned Value in the current period for future effort.  Alternately, if tasks are not statused with actual start or finish dates prior to the Data Date, then they cannot be logically started or finished until at least the day of the Data Date, if not later.  If the forecast dates are not moved to the Data Date or later, the schedule cannot be used to correctly calculate Driving Paths to an Event Milestone, or calculate the Program Critical Path.

10.  No Assigned Resources

The test: Percentage of incomplete activities that do not have resources assigned to them.

The threshold: 0%.

This is a complex check because of two basic factors: 1) resources are not required to be loaded on tasks unless directed by the contractor’s internal management requirements, and 2) some tasks such as Schedule Visibility Tasks (SVTs) and Schedule Margin tasks should not be associated with work effort.  If the contractor chooses not to load resources into the schedule the options are:

  1. Associate basic quantities of work with tasks and define in a code field, transfer those quantities to the EVM cost system and verify the traceability between the IMS quantities and the associated budgets in the cost system.
  2. Maintain the budgets entirely in the EVM cost system and provide a trace point from the activities in the IMS to the associated budgets in the cost system.  The trace points are usually in the form of control account and work package/planning package code values.

In either case, care must be exercised so that Schedule Visibility Tasks are reviewed and confirmed to ensure that work is not misrepresented to either the contractor or the customer.

11.  Missed Activities

The test: Percentage of completed activities, or activities that should have been completed based on their baseline finish dates, and failed to finish on those dates.

The threshold: 5%.

Many people view this as a performance metric.  That is true, but it is also used to review the quality of the baseline.  For example, if a project has a 50% failure rate to date, what level of confidence should the customer have in future progress?  Is the baseline a workable plan to successfully complete the project?  Does the EVM System reflect the same issues as the IMS?  If not, are they correctly and directly connected? These are questions that should be addressed by the contractor before the customer or other oversight entities ask them.

12.  Critical Path Test

The test: Select a task on the program Critical Path and add a large amount of duration to that task, typically 600 days.

The threshold: The end task or milestone should slip by as many days as the delay in the Critical Path task.

This is a test of the integrity of the schedule tool to correctly calculate a Critical Path.  If the end task or milestone does not slip by as many days as the artificial delay, there are structural issues inhibiting this slip.  These issues may be logic links, hard constraints or other impediments to the ability of the schedule to reflect the slip.  These issues should be addressed and corrected as the schedule data is to be relied upon to provide meaningful information to management.

13.  Critical Path Length Index (CPLI)

The test: The Critical Path length + the Total Float on the Critical Path divided by the Critical Path Length.  This formula provides a ratio that puts the Critical Path Float in perspective with the Critical Path length.

The threshold: .95 or higher.

If the program is running with zero (0) Total Float on the Program Critical Path, then the ratio is 1.00.  If there is negative float on the Program Critical Path, then the ratio will fall below 1.00 which indicates that the schedule may not be realistic and that project milestones may not be met.

14.  Baseline Execution Index

The test: The number of completed activities divided by the number of activities that should have been completed based upon the baseline finish dates.

The threshold: .95 or higher.

This check measures the efficiency of the performance to the plan.  As such, some people also dismiss this as a simple performance metric, but as in the case of Metric #11 (Missed Tasks), this is also a measurement of the realism of the baseline plan.  As in Metric #11, if the schedule performance is consistently not to the plan, how viable is the plan?  How viable is the EVMS baseline?  How accurate is the information from the baseline that Management is using to make key decisions?  Metrics #11 and #14 may reflect the result of the effort being performed on the contract, but also represent the quality and realism of the baseline plan.

What are additional metrics that help identify schedule quality issues?

The DCMA’s 14 point schedule assessment should be considered a basic check of a schedule’s health, but by no means is the only check that should be used to analyze an IMS.  More industry standard checks are identified in other documents, including the Planning and Scheduling Excellence Guide (PASEG) revision 2.0 (6/22/12). The PASEG is a National Defense Industrial Association (NDIA) product and was developed in cooperation between industry and the Department of Defense. Section 10.4, Schedule Execution Metrics, discusses in greater detail some of the Health Metrics identified above, as well as other metrics including the Current Execution Index (CEI) and the Total Float Consumption Index (TFCI).

In addition to these metrics, checks should be performed on activity descriptions, activity code field values, risk inputs, Earned Value Techniques and other tests to assure alignment of the IMS with its partner information systems.  These systems include, but are not limited to the MRP system, the cost system, program finance systems and the risk management system.  The IMS in an integral component of a company’s management system, therefore issues with the IMS data will be reflected in the other components of the EVMS.

All of the above health checks can be performed manually with the use of filters and grouping functions within the scheduling tool; however, they may take too much time and effort to be successfully sustained.  The marketplace has tools available to perform these and other checks within seconds, saving time and cost, allowing schedule analysts and management to devote valuable time to address and resolve the issues.  With the aid of these tools, a comprehensive schedule health check can be performed as part of the business rhythm instead of an occasional, time available basis.

Summary

Schedule Health Metrics are an important component of the schedule development and maintenance process.  While the DCMA has established some basic standards for schedule health assessments, the 14 metrics should not be considered the only checks, but just the beginning of the schedule quality process.

Schedule checks should be an integral part of the schedule business rhythm and when issues are identified, they should be addressed quickly and effectively. Significant numbers of tasks that trip the metrics, or persistent issues that are not resolved, may require a Root Cause Analysis (RCA) to identify the reasons for the problems and to develop a plan to address them.

Give Humphreys & Associates a call or send us an email if you have any questions about this article. 

Schedule Health Metrics Read Post »

Earned Value and Negative Float

Earned Value and Negative FloatQuick.  What do Bankers, Ship Captains and Program Managers have in common?  Answer: They all want to address negative float issues in a timely manner.

While those of us working in program management are not concerned so much with a ship’s ability to stay afloat or financial maneuvers, we should be concerned with earned value and negative float in the schedules.  It is an important warning sign that one or more of the Program’s schedule goals cannot be met with the current plan.

As described above, the term ‘negative float’ has different meaning to different people even within the project management community.  To be precise, the term refers to a property assigned to each task or milestone in the schedule called Total Float, or Total Slack in Microsoft Project.  The values in the property usually represent days and are assigned as a result of a scheduling analysis run.  These numbers can be positive, zero or a negative number of days:

  1. For tasks with positive numbers assigned to the Total Float property, the tasks can be slipped by that number of days before impacting a milestone or the end of the project.
  2. When the task Total Float value is zero, the task cannot slip at all.  Conditions 1 and 2 should be the norm, with all tasks having zero or higher total float values.  If the schedule were well constructed, has realistic task durations and includes all discrete scope, the schedule indicates the project has a good plan in place to achieve its goals, albeit contractual or internal.
  3. When tasks have negative float values, the schedule is sounding an alarm.    Tasks with negative float values indicate probable failure to meet one or more completion goals.  These goals are represented in the schedule as date constraints assigned to tasks or more preferably, milestones. These date constraints represent necessary delivery deadlines in the schedule and if the current schedule construct is unable to meet those delivery deadlines, negative float is generated on every task that is linked in that potential failure.  The more tasks with negative float, and the larger the negative float values on those tasks, the more unrealistic the schedule has become.

If the schedule contains tasks with negative float, the first step is to quantify it. This can be performed in the tool using filters or grouping by float values.  Analysis tools, such as Deltek’s FUSE, Steelray or the DCMA’s new Compliance Interpretive Guide (CIG), are used to evaluate contractor delivered data and provide metrical analysis to Auditors prior to a review.  The tolerance threshold in the CIG (current nickname ‘Turbo’), as in all schedule analysis tools, is 0 (zero) percent of tasks with negative float.

Once identified, the next step is to determine the cause of the issue(s).  Because negative float is generated by a date constraint in the schedule, if the end point can be determined, then the predecessors can be identified that are forcing the slip to the end point.  One of the easiest ways to do this is to group the schedule by float and sort by finish date.  This is because most of the string of tasks that push a task/milestone with a delivery date constraint share the same float values; look for those groups of tasks with the same negative float values.

The final step is to take action.  Planners, CAMs and their managers should meet and collaborate to determine the cause and options available to solve the issues.  These meetings should result in a corrective action plan to solve the problem. In general, there are five options available to the program team:

  1. Change durations – if the negative float leading up to a delivery point were low, perhaps additional resources assigned to those tasks may help reduce the durations of the activities and relieve the negative float issues.  It is important to understand that reducing durations just to avoid a bad metric reading for negative float is just putting off the issue until the ultimate surprise is delivered; a delay in delivery, and all the pain associated with that delay (penalties, lost award fees, lost business if consistently late, etc).
  2. Change relationships – perhaps some tasks may be run in parallel instead of in series. A review of all the logic contributing to the negative float condition should be performed and adjustments should be made only if they make sense.
  3. Review date constraints in the Integrated Master Schedule (IMS) – for example, if subcontractors could deliver product earlier, that could also help solve the issue. If waiting for customer-provided equipment or information, perhaps the effort can be accelerated to relieve the stress on the schedule.
  4. Consume Schedule Margin – If there is still negative float leading up to a major contract event or contract completion, and if all of the above options have been exhausted, the PM has the option to use a portion of the Schedule Margin to relieve the negative float pressure leading up to the milestone.  If the Schedule Margin were represented by a bar, it means decrementing the forecast duration of the bar.  If the Schedule Margin were represented as a milestone, the date constraint on that milestone can be changed to a later point in time, but not later that the contractual delivery date assigned to it.
  5. Ask for relief – if, after all processes above have been completed and the schedule still has negative float indicating an inability to meet schedule deadlines, it is time to have a discussion with the customer.  It is usually better to have these bad news discussions earlier rather than later when there is still time to implement work-around or corrective action plans.  The customer has been reading the same schedule and may have helpful suggestions to solve the problems or could potentially provide contractual relief for the delivery dates.   As a last resort, the contractor can inform the customer and seek concurrence that an Over Target Schedule (OTS)* should be instituted to relieve the schedule condition and a more realistic schedule developed.  This is an option of last resort and should not be taken lightly unless all of the other options have been thoroughly explored. *See our blog: Is it OTB/OTS Time or Just Address the Variances?
    .

Summary

The definition of a schedule is a time phased plan that defines what work must be done, and when, in order to accomplish the project objectives on time. Earned value and negative float is a condition in the schedule that indicates the project will be unable to meet one or more of its objectives. It should not be ignored, or worse, marginalized with slap-dash tricks to get rid of it such as deleting relationships or reducing durations to zero.

Instead, negative float should be quantified, analyzed and addressed with a corrective action plan which includes steps and follow-up reviews to ensure adequate remediation of the problem.  It is a zero tolerance metric with most customers and, if not addressed internally, will most likely be identified by the customer for action.

Contact Humphrey’s & Associates, Inc. with questions or information on how to set up a corrective action plan for earned value and negative float. 

Earned Value and Negative Float Read Post »

Scroll to Top