Program Manager / Project Manager Use of Management Reserve
What is Management Reserve?
Management Reserve (MR) is developed and managed by the Program Manager / Project Manager. This discussion will provide guidance for establishing and using Management Reserve to effectively manage a project.
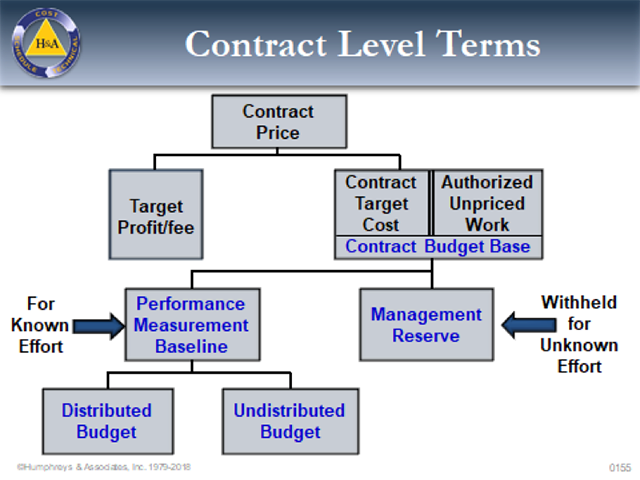
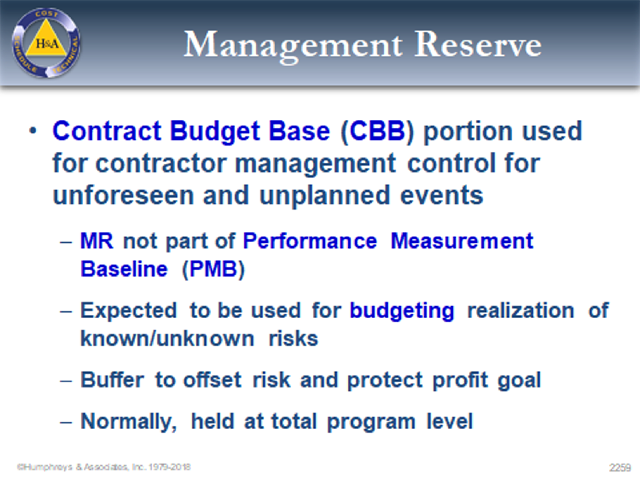
H&A description– The standard definition of management reserve is an amount of contract budget set aside for management control purposes (known unknowns) rather than designated for the accomplishment of one or more tasks. It is not part of the performance measurement baseline (PMB) but is included in the contract budget base.
DOE guidance – The ability to establish MR allows project management to react to unforeseen in‐scope situations that arise during the life of a project. It is budget for handling project risk and in‐scope unanticipated events. Management Reserve is not a source of funding for additional work scope or for the elimination of performance variances. It is an amount of the project budget set aside for management control purposes by the contractor. Management Reserve is the contractor’s budget and provides the project manager with a budget for unplanned activities within the current project scope. Because MR is budget that is not yet associated to work scope, it is not part of the PMB.
The Earned Value Management System Description (EVMSD)
The contractor must include a clear definition of MR in the EVM SD. For clarity and consistency, the EVM SD must describe the process and list allowable conditions under which it may be approved and allocated to the control accounts managers. Management Reserve cannot be used to offset accumulated overruns or under runs. Authorized uses of it include:
- Previously unrecognized tasks or realized risks consistent with the general scope of work of the contract.
- Change in execution strategy (e.g., make/buy decisions).
- Unexpected future internal scope growth within the currently authorized scope of the project.
- Direct and indirect rate changes and currency fluctuations.
- Risk and opportunity handling (not for cost or schedule variance based risks).
- Work that needs to be repeated (not the result of inaccurately reported progress).
- Changes to the future budget of work not yet started (e.g., subcontractor activities that are negotiated post project award).
Baseline Planning
The first step in the process the PM must accomplish is establishing the Management Reserve at the initiation of the Performance Measurement Baseline development. The project manager has authority and control of the development and use of the MR budget.
The process steps are:
- Reconciling the proposal estimates with the contract award.
- The project manager will establish an MR budget based on examination of the contractual scope of work. Factors affecting the MR budget establishment are high technical risk areas, complex schedule problems, or an anticipated shortage in a critical resource area such as labor, material, or support services.
- Once anticipated problem areas are isolated, Negotiations between the Project Manager and the Control Account Managerscan begin to determine the Control Account Budgets. This is an iterative process during which the PM will negotiate with the CAMs:
- The budget amount to be withheld from each Control Account(based on the results from step 2 above).
Evaluating the scope of work, risk associated with the scope of work, maturity of the concepts/ designs/ manufacturing included in the scope of work and the CAMs past performance on similar projects. - The PM can target a specific percent of the awarded budget based on the complexity, risk and duration of the contract and the scope in each control account
- The budget amount to be withheld from each Control Account(based on the results from step 2 above).
- The PM will negotiate and issue budgets to the CAMs and the balance remaining from the authorized budgets and the Contract Budget Base establishes the Management Reserve. Typically, this amount should be 10-15 % of the CBB value.
The next step for the PM is to track the MR budget. This is done by creating a Management Reserve Log. This can be a separate log or part of the Contract Budget Base log.
- Record the original amount of MR after the control account budgets have been authorized to the CAMs.
- Record changes to MR as additional budgets are authorized to increase or decrease control account values. (Management reserve is decreased to provide budget for unplanned tasks within the contract scope of work or increased whenever work is decreased along with the allocated budget.)
- Use the logs to report MR activity in the monthly reports to the customer.
Project Execution
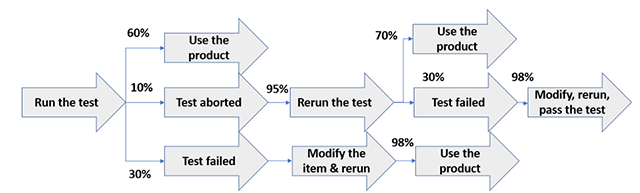
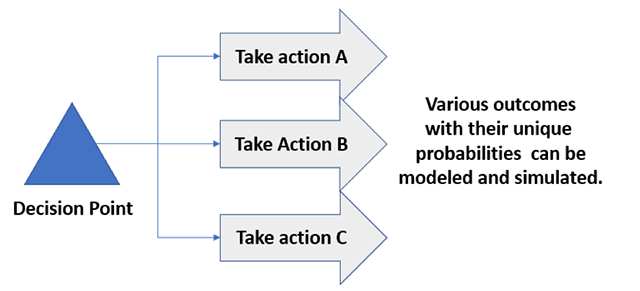
During the actual execution of the project the PM may experience various scenarios that will require the use of Management Reserve. The process to identify, evaluate and authorize MR transactions should include the following steps:
- Either the CAMs or the PM can identify new tasks or realized risks to be performed or deleted in the Control Account efforts.
- The affected areas in the control accounts will be identified and the impacts quantified (resources/ time …..) for the scope being modified. Tasks identified to be outside of the Control Account scope (but within the overall Project Contract scope) will be authorized and budgeted from the Management Reserve. Reductions to the Control Account scope will be authorized and the appropriate budget and scope returned to the Undistributed Budget, where the SOW is deleted and the associated budget credited to the Management Reserve.
- Management Reserve transactions cannot be made without identified scope being added/reduced from the Control Account and the associated budget recorded in the MR Log and updated Work Authorization documentation issued to the Control Account Managers.
- Changes in the MR log will be identified and described in the monthly customer reports. If the transaction was for an identified Risk, the Risk Registerwill also be updated and reported to the customer.
- Use the Change Control process to document the rationale for all baseline budget and schedule revisions.
Acceptable Uses of Management Reserve (Examples)
- Authorize additional budget/ scope for previously unrecognized tasks and identified risks that are consistent within the scope of work of the contract.
- Authorize changes in execution strategy such as a make/buy modification.
- May be used to offset changes in direct/ indirect rates and currency fluctuations.
- May be used for Risk/ Opportunity handling (does not include Cost or Schedule Variance based risks).
- May be used for work that needs to be repeated.
- May be used to adjust budgets for final negotiations with subcontractors.
Unacceptable Uses of Management Reserve
- Cannot be used to cover overruns.
- No changes to open Work Packages without customer approval.
- MR cannot be a negative value.
Project Manager Authority/ Responsibility
- Management Reserve belongs to the Project Manager.
- The PM is responsible for controlling MR transactions.
- The PM may or may not allocate MR based on the assessment of the CAMs requests and availability of MR balance.
- The PM is responsible to ensure that all MR transactions are documented, reported, and traceable.
Summary
Management Reserve is a critical part of the PM’s toolkit. It allows the PM some flexibility in planning for Risks and Opportunities, and for required changes that are in scope to the contract but were not identified in the original baseline planning. The company’s EVM SD is the primary guide the PM should use in determining which MR requests are allowable and those that are not valid.
Some Data contained in this paper came from Humphreys & Associates and from DOE EVMS websites.
Program Manager / Project Manager Use of Management Reserve Read Post »