EVM Training – Decision Making & Charlie Munger – Part 1

Tendency Toward Misjudgment – Part 1
Charlie Munger and EVM Training
So, what does Charles (Charlie) T. Munger, Vice Chairman of Berskshire Hathaway and partner of Warren Buffet have to do with EVM training? Decision Making. You can imagine the big-money decisions he has helped Buffett make during the many years of building up the legendary outfit. Along the way, he kept track of the happenings around him that through various speeches and writings espoused some clear thinking. Born in Omaha in 1924, Charlie began working with Warren at Buffett & Son, a grocery store owned by Warren Buffett’s grandfather. Eventually graduating magna cum laude from Harvard Law in 1948, Charlie moved into the business world.
Psychology of Human Misjudgment
This blog is narrowly focused on what I gleaned from Charlie’s writings about the “psychology of human misjudgment.” Looking to see how this information could be used to help guide a EVM training workshop on the topic of decision making, I went through each of the 25 “tendencies” that he defined and discussed. I would never have guessed that we humans have 25 tendencies that impinge on our thinking processes, but after studying his list, I think he nailed it. Most of the tendencies are backed up with some reference to psychological studies; so be assured Charlie did not make them up. This blog will treat them in numerical order and will add thoughts from the Humphreys & Associates earned value training material on decision making that will make the Charlie Munger points more specific to the subject at hand.
In our EVM training material, we emphasize the process of decision making is critical, and Charlie thought so way before I did. Bad decisions can come from good processes, but that is less likely than bad decisions coming from no process or, even worse, from a bad process. At one point Munger advises the use of checklists can help navigate through the minefield of human tendencies toward misjudgment. An amazingly timely idea, because here at Humphreys & Associates we are just wrapping up our work on “The Big Book of Project Management Checklists” that is aimed at doing just that.
Blocking Human Misjudgement
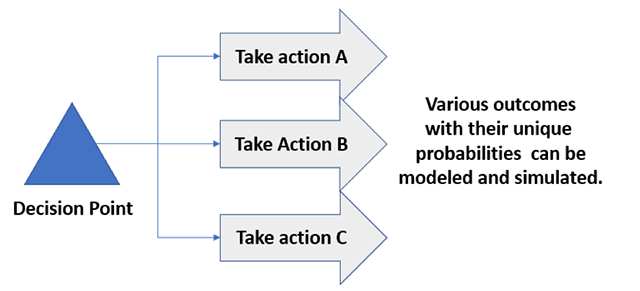
What about human misjudgment? It appears we humans are fraught with innate tendencies that, if not blocked, can lead us to make misjudgments. A misjudgment would be a wrong decision in terms of this blog. With all that follows in the blog about misjudgment, we are trying to discern a sound process for earned value decision making, with tools like decision trees, that can help avoid or counter the influences of the counterproductive tendencies. Developing your decision-making process should involve findings tactics that help you avoid or defeat or neutralize these tendencies in your EVMS processes.
Tendency #1 – Reward and Punishment Super-Response
Let’s cover one tendency as an example. Tendency #1 is called the “Reward and Punishment Super-Response Tendency.” The word “super” attached to the idea of response to reward is to emphasize that this is a case of over responding. We all know people move toward what is incentivized; they seek the reward. It must be obvious that, if the wrong thing is incentivized, people will be moving in the wrong direction. According to Munger, there is a strong tendency to move toward the reward; an overly strong tendency. Charlie cites some great examples from his experience. Your decision-making process should include some “clearing the minefield” efforts early on in the process to make sure that the decision will not be made in a move toward a reward that would be wrong for the situation. A simple example could be that you are involved in deciding about launch-ing a long-term effort that would cost quite a bit that does not have certainty to the outcome. If you are incentivized toward short terms profits, then you have the biased tendency to discard the idea in favor of short term gains.
Deprival Super-Reaction Tendency
There is a potentially related tendency called the “Deprival Super-Reaction Tendency.” This is the tendency to feel more pain from a loss than to feel pleasure from a gain of the same amount or thing. According to this tendency, there is more motivation associated with avoiding pain than making a gain. The see-saw is weighted in one direction. How counterproductive is that tendency toward carefully considered decision-making? If we are trying to make a gain in our decision process, we are not only fighting the facts of the situation but also our innate bias against taking a risk. The idea can be seen in the commonly observed action of throwing good money after bad. A loss is imminent, so the decision is to spend more to head it off to potentially save the day and avoid the pain; is that wise? Think about the situation where someone says or is known to think that “I will not be denied no matter the cost.” You probably do not want that kind of thinking involved in your decision making. Now think about a situation where tendency #1 and tendency #2 both align against one of the options being considered. Would an option that faces the tendency to risk some pain of loss and to move against a potential reward stand a chance if those tendencies were not neutralized?
Blog Series
Hopefully you get the idea now. This blog will be followed by another that covers some of the remaining tendencies identified by Charles T. Munger. I hope to learn more from and will translate what I learn here and in our EVM training material. Stay tuned.
EVM Training – Decision Making & Charlie Munger – Part 1 Read Post »