EVMS

EVM Training – Decision Making & Charlie Munger – Part 1

, , , , ,

Large Radio Antenna with Dawn Sky in the Background image for EVM Training - Decision Making and Charlie Munger blog post


Tendency Toward Misjudgment – Part 1


Charlie Munger and EVM Training

So, what does Charles (Charlie) T. Munger, Vice Chairman of Berskshire Hathaway and partner of Warren Buffet have to do with EVM training? Decision Making.  You can imagine the big-money decisions he has helped Buffett make during the many years of building up the legendary outfit. Along the way, he kept track of the happenings around him that through various speeches and writings espoused some clear thinking. Born in Omaha in 1924, Charlie began working with Warren at Buffett & Son, a grocery store owned by Warren Buffett’s grandfather. Eventually graduating magna cum laude from Harvard Law in 1948, Charlie moved into the business world.

Psychology of Human Misjudgment

This blog is narrowly focused on what I gleaned from Charlie’s writings about the “psychology of human misjudgment.” Looking to see how this information could be used to help guide a EVM training workshop on the topic of decision making, I went through each of the 25 “tendencies” that he defined and discussed. I would never have guessed that we humans have 25 tendencies that impinge on our thinking processes, but after studying his list, I think he nailed it. Most of the tendencies are backed up with some reference to psychological studies; so be assured Charlie did not make them up. This blog will treat them in numerical order and will add thoughts from the Humphreys & Associates earned value training material on decision making that will make the Charlie Munger points more specific to the subject at hand.

In our EVM training material, we emphasize the process of decision making is critical, and Charlie thought so way before I did. Bad decisions can come from good processes, but that is less likely than bad decisions coming from no process or, even worse, from a bad process. At one point Munger advises the use of checklists can help navigate through the minefield of human tendencies toward misjudgment. An amazingly timely idea, because here at Humphreys & Associates we are just wrapping up our work on “The Big Book of Project Management Checklists” that is aimed at doing just that.

Blocking Human Misjudgement

What about human misjudgment? It appears we humans are fraught with innate tendencies that, if not blocked, can lead us to make misjudgments. A misjudgment would be a wrong decision in terms of this blog. With all that follows in the blog about misjudgment, we are trying to discern a sound process for earned value decision making, with tools like decision trees, that can help avoid or counter the influences of the counterproductive tendencies. Developing your decision-making process should involve findings tactics that help you avoid or defeat or neutralize these tendencies in your EVMS processes.

Tendency #1 – Reward and Punishment Super-Response

Let’s cover one tendency as an example. Tendency #1 is called the “Reward and Punishment Super-Response Tendency.” The word “super” attached to the idea of response to reward is to emphasize that this is a case of over responding. We all know people move toward what is incentivized; they seek the reward. It must be obvious that, if the wrong thing is incentivized, people will be moving in the wrong direction. According to Munger, there is a strong tendency to move toward the reward; an overly strong tendency. Charlie cites some great examples from his experience. Your decision-making process should include some “clearing the minefield” efforts early on in the process to make sure that the decision will not be made in a move toward a reward that would be wrong for the situation. A simple example could be that you are involved in deciding about launch-ing a long-term effort that would cost quite a bit that does not have certainty to the outcome. If you are incentivized toward short terms profits, then you have the biased tendency to discard the idea in favor of short term gains.

Deprival Super-Reaction Tendency

There is a potentially related tendency called the “Deprival Super-Reaction Tendency.” This is the tendency to feel more pain from a loss than to feel pleasure from a gain of the same amount or thing. According to this tendency, there is more motivation associated with avoiding pain than making a gain. The see-saw is weighted in one direction. How counterproductive is that tendency toward carefully considered decision-making? If we are trying to make a gain in our decision process, we are not only fighting the facts of the situation but also our innate bias against taking a risk. The idea can be seen in the commonly observed action of throwing good money after bad. A loss is imminent, so the decision is to spend more to head it off to potentially save the day and avoid the pain; is that wise? Think about the situation where someone says or is known to think that “I will not be denied no matter the cost.” You probably do not want that kind of thinking involved in your decision making. Now think about a situation where tendency #1 and tendency #2 both align against one of the options being considered. Would an option that faces the tendency to risk some pain of loss and to move against a potential reward stand a chance if those tendencies were not neutralized?

Blog Series

Hopefully you get the idea now. This blog will be followed by another that covers some of the remaining tendencies identified by Charles T. Munger. I hope to learn more from and will translate what I learn here and in our EVM training material. Stay tuned.

EVM Training – Decision Making & Charlie Munger – Part 1 Read Post »

EVM Consulting – Modeling & Simulation

, , , , , , , , ,

Fighter Jet Air Plain Flying in Front of Moon

Forewarned is Forearmed

Forewarned is forearmed. John Farmer, of New Hampshire, said that in a letter in 1685. But that advice is most likely biblical and very much older. No matter the source of the thought, we should take it as divine guidance if we are project managers. Maybe we should have it cut into a stone tablet, so we can share it with our team members.

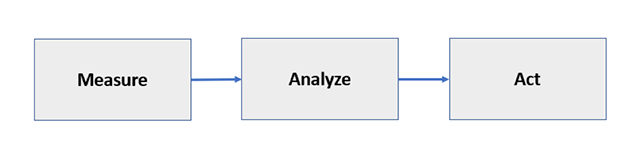
Most of our work as project managers is spent in the “controlling” phase which is made up of the three steps “measure, analyze, act.” Our EVMS and IMS exist to be able to support this management function. The measuring part is done very well in our EVMS and our IMS; we know where we are and how we got there. The analyzing is equally well handled in the IMS and EVMS. Only the management task of acting is not well supported. Generally, we lack decision making support and tools.

EVM Consulting - Measure, Analyze, Act

Deterministic Path

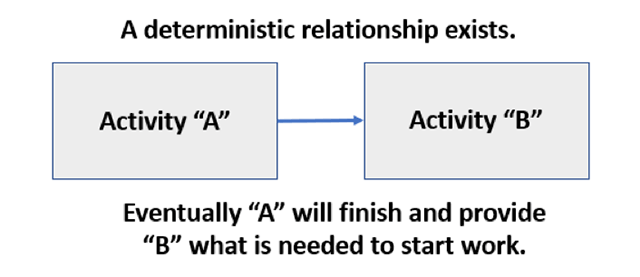
No matter how well constructed and how healthy our IMS is, it has a deterministic path forward. The logic links between the activities are there because we expect them to be fulfilled. Indeed, if activity “B” is a finish-to-start successor to activity “A” we fully expect that at some point activity “A” will finish and will provide its output to activity “B”. That is a single path forward and it is a deterministic path. It is also a somewhat simplistic model.

EVM Consulting - Deterministic Relationships in EVMS

Multiple Outcomes

Our management system asks us to perform root cause analysis followed by corrective action. But what if there is more than one corrective action to be taken. And worse; what if the corrective actions can have multiple outcomes with each enjoying its own probability. That means multiple choices and multiple outcomes. How would we show that in our plan? How would we analyze the multiple possible futures that such a situation presents?

Happily, there are ways to model a future without a set path. And once we have the future model, there are also ways to simulate the outcomes to give the probabilities we need to decide which actions to take. We are talking about probabilistic branching, and we are saying that we can build a probabilistic map of the future to use in making decisions; especially making decisions on corrective actions.

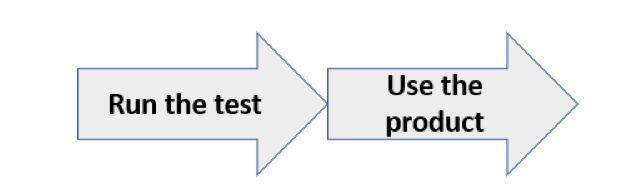
Take a simple example of running a test on the project. The expectation is that eventually we will pass the test. We will keep trying until we do. In the IMS deterministic model the test portion of the IMS might look like this:

EVM Consulting - Run the Test then Use the Product

Simulation

We can simulate this situation with different expected durations for the test. That is helpful information, but it does not explain or even capture what is going on in those different durations. It looks like we are just taking longer to do the testing but is that really what is happening? What is going on here? We certainly don’t show that.

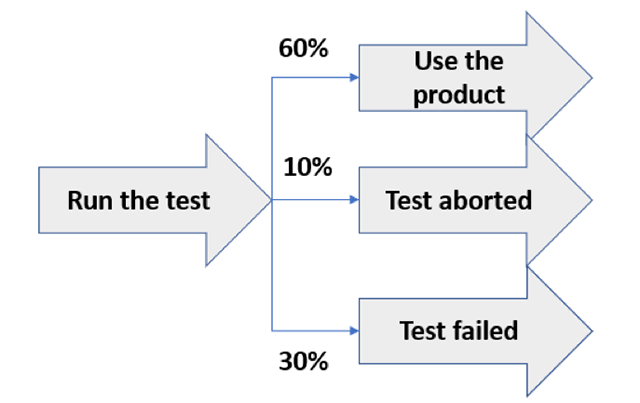
In the real world, this simple model might have three potential outcomes. There might be three paths we can take to get to the point where we use the product. Each path has a time and money cost. We might run the test and find that we passed. Or we might have to stop the test for issues on the item or the test setup. We might even fail the test and must correct something about the product to improve our chances of passing a rerun. Eventually we will get to a usable product. But what do we put in our estimate and our plan? What do we tell the resources we need? What do we tell the boss? The customer?

EVM Consulting - Real World Testing

Full Future Model

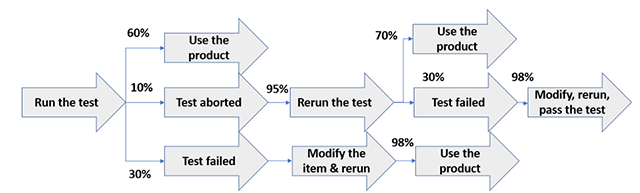
We now have a much better understanding of the future and can explain the situation. We also can simulate the situation to find out the most likely time and cost outcomes, so we can explain the future without any histrionics or arm waving.
If the issue is important enough we can build out the full future model and simulate it.

EVM Consulting - Full Future Model and Simulation

No matter how far we pursue the model of the future, having a valid model and being able to stand on solid ground are very valuable to us as project managers.

This is not to say that we should model out complex situations as a routine in the IMS. That would be impossible, or at least prohibitively costly. We are saying that when situations arise, we need to be able to use the IMS to help us make decisions.

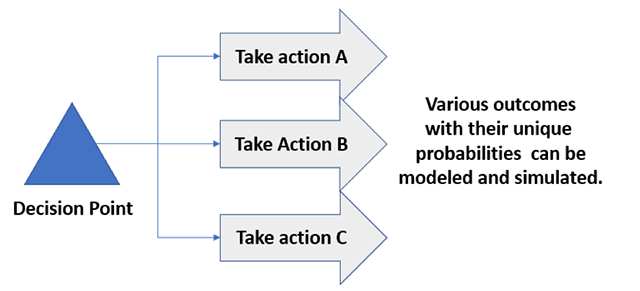
This type of probabilistic modeling of the future is particularly useful in defining major decision points in our plan. When we reach a decision point the IMS may have multiple branches as successors but that implies we take every branch and that is not valid. Modeling each branch and its probabilities is valid. In the example below, where the milestone represents a decision point, we have shown three possible paths to take. If each were modeled out into the future with time and cost data, we should have the information we need to choose the path we wish to pursue. Without processes and tools like this, we would be flying blind.

Future Blog Posts

This discussion will be continued in future blogs to develop a better foundational understanding of the process and power of probabilistic modeling in our EVMS.

EVM Consulting - Decision Point

Good information sets the stage for good decisions. The IMS and the EVMS have sufficient information to help us model the pathways ahead of our critical decisions. We just need to learn to take advantage of what we have available to us.

Find out how an experienced Humphreys & Associates EVM Consultant can help you create a full future model and simulation of your most vital EVMS Systems. Contact Humphreys & Associates at (714) 685-1730 or email us.

EVM Consulting – Modeling & Simulation Read Post »

Along the IMS Time-Now Line

, , , , , , , , , , , ,

Arrows moving to the right.Recently one of our consultants was instructing a session on the Integrated Master Schedule (IMS) with a group of project personnel from one of our larger clients. The group was a mixture of beginners with no real experience in schedules and some much more experienced practitioners; some with more than 10 years of experience. The mixture made it somewhat difficult, but it also made for some interesting discussions that might have been missed in a more homogenous group. One of those things was the usefulness or importance of the “time-now” line.
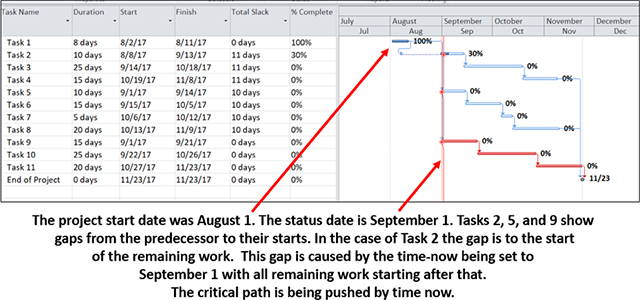
When the group was asked about the importance of the time-now line and what information could be easily gained from a look at the line, there was silence. The beginners did not have a clue but also none of the experienced people had any response. What should have been a short discussion with just one “slide” as a visual, turned out to be a longer and more informative session on this topic.

The time-now line has different names in different software tools but it refers to the data date, or status date, of the schedule. That also would be the first day of the remainder of the schedule. When a scheduler sorts tasks by date, the time-now line runs down the screen and forms a highly useful visible reference.

In the small example below [see Figure 1], you can see the time-now line and visually assess the situation. Time-now is shown by a vertical line at the beginning of September, so all remaining effort has been scheduled to after that date. In other words, no work can be forecasted in the past. A walk down the line shows Task 1 has both started and completed. Task 2 started but has not completed. In fact, the remaining work in Task 2 has been pushed out by the time-now line. The start of Tasks 5 and 9 are also being pushed out by the time-now line. In most real project schedules, filters and other techniques may be needed to isolate information like this; but in our small example, we can simply “eyeball” the time-now line and see valuable information. Task 9 starts the critical path shown in red tasks.


The project start date was August 1. The status date is September 1. Tasks 2, 5, and 9 show gaps from the predecessor to their starts. in the case of Task 2 the cap is to the start of the remaining work. This gap is caused by the time-now being set to September 1 with all remaining work starting after that. The critical path is being pushed by time now.Figure 1


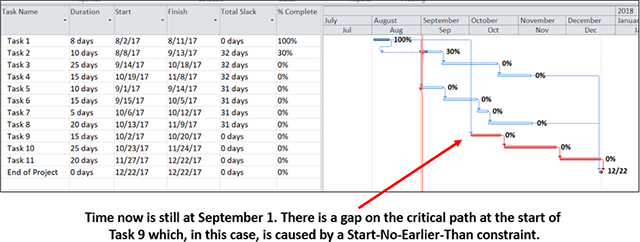
A slightly different setup for that same small example [see Figure 2] shows something interesting. The time-now line is still at the beginning of September. But now there is a gap between time-now and work on the critical path. This is an unusual situation and should be investigated for the root cause. It is possible this is an accurate portrayal of the situation, but regardless of the cause, it must be verified and explained.


Time now is still at September 1. There is a gap on the critical path at the start of Task 9 which, in this case, is caused by a Start-No-Earlier-Than constraint.Figure 2


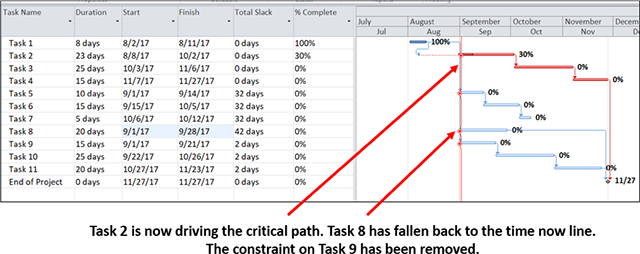
In yet one more variation [see Figure 3], we see that a broken link results in Task 8 ending up on the time-now line. A task without a predecessor will be rescheduled to start at the earliest possible time (if the task is set to be “As Soon As Possible”). And the earliest possible time is the time-now line; the beginning of September. Just as broken things fall to the floor in real life, “broken things” fall to the time-now line in a schedule. Un-started work can land there. Un-finished work can land there. And un-linked work can land there.

It is further possible to see that Task 2 has had an increase in the remaining duration that has driven it onto the critical path. Task 2 at this moment is the most important task on the entire project. A slip to Task 2 will drive out the end date for the entire project. One question that needs answering is what is holding up Task 2?

If the display had been sorted by increasing total float/slack and the usual cascade by date, then the critical path would be starting at the upper left-hand corner; like the critical path in this example. The action on the project is almost always on the time-now line and the most important action, when sorted as described, will be at the upper left-hand corner.


Task 2 is now driving the critical path. Task 8 has fallen back to the time now line. The constraint on Task 9 has been removed.Figure 3


So, a walk down the time-now line can help us see the critical path action, find broken parts of the schedule, and locate unusual circumstances that need our attention. Our recommendation is to look at the time-now line any time there is data being changed in the IMS. This will help you catch issues early and keep the schedule cleaner.

Along the IMS Time-Now Line Read Post »

Agile/Scrum Ceremonies and Metrics Useful in EVMS Variance Analysis and Corrective Action

, , , , , , , , , , , , , , , , , , , , , , , , , ,
Agile Scrum EVMS

P. Bolinger, CSM October 2016
Humphreys & Associates

How can Agile/ Scrum be used to support EVMS Variance Analysis and Forecasting in a way that provides program managers with cost and schedule integrated information for no extra effort?

The discipline of EVMS and the Agile/Scrum practices have several touch-points that are covered in two major documents: NDIA IPMD Agile Guide March 2016, and PARCA Agile and EVM PM Desk Guide. Neither of these documents, as yet, drives to the level of specifics when it comes to best practices for use of Agile to support EVM Variance Analysis and EVM Forecasting.

Looking at the literature for Agile/Scrum, we know that there are recommended ceremonies that are conducted at various levels of the product structure and at different times during the project life cycle. These ceremonies are supported by many discussions of the metrics that can be collected at each ceremony and their potential use in managing the technical work of development within the Agile/Scrum framework. But where do these ceremonies potentially support EVMS Variance Analysis and Forecasting?

Now suppose we are presented with a control account that has exceeded the EVMS thresholds for cumulative cost and schedule variances. Wouldn’t it be great to have at our fingertips the underlying data from the process? In this case we might find, for example, that the Velocity is less than that needed to meet the end goal, the story cycle time is longer than desired, the pass/fail ratio is not favorable, too many team members have been absent in the last Sprint, the number of disruptions has been excessive, and the work to accomplish the stories is higher than estimated. It is not difficult to surmise the outcome would likely be a behind schedule and overrun condition in the EVMS. These data measures would provide the fodder for deep diving to the root cause and impact statements.

Where would we get that information?

Let’s start with the Agile/Scrum ceremonies. The particular Agile/Scrum ceremonies that we find conducted during the project are:

Backlog Refinement. This ceremony can be nearly continuous. It involves redefining the backlog of development work (scope), the prioritization or re-prioritization of that work, and potentially the assignment of responsibilities for the backlog.

Release Planning. This is a recurring ceremony aligned with the release cadence for the project. It involves establishing the capabilities and features of the product and when they will be released.

Sprint. This is a short time-defined effort to accomplish the design, code, and test of some subset of the product. The Sprints are controlled by the self-managing teams.

Daily Scrum or Standup. This is a daily (recommended) team meeting to discuss what has happened, what roadblocks exist, what is planned for the day, and other necessary items.

Sprint Review. The session in which the team products are demonstrated to the owner and self-off is accomplished.

Sprint Retrospective. A meeting of the stakeholders to discuss what went right (or wrong) during the Sprint and to define improvement actions that are needed.

The relationship of these Agile ceremonies with EVMS might look like this:

Agile/Scrum Ceremony

Agile Purpose

Relationship to EVM Variance Analysis, Root Cause Analysis, Corrective Action Planning & Follow-up and Forecasting


Backlog Refinement Manage, estimate, prioritize, and organize the product backlog in an on-going routine. Estimating – impacts the EVMS ETC and EAC as well as durations of efforts.
    Prioritizing – in response to issues is corrective action management.
    Organizing the backlog could be a form of corrective action effort.
     
Release Planning Establishing the contents and timing for releases of product. Updates could be part of corrective action planning in response to issues. Creation of new work packages. Changes to planning packages and SLPPs would also.
     
Sprint Short time-box performance unit. Work is done in Sprints. Below the work package. Short span measurement period is possible.
     
Daily Scrum and Stand-up Make short term plan, adjust to issues, discuss problems, clear roadblocks. Much of the daily action would relate to root cause analysis and corrective action planning although the time-frame is very short and the issues may be too small to individually impact feature work package or the Epic control account.
     
Sprint Review Demonstrate the product, update released work, make changes to product. This would relate to corrective action planning and follow-up. Issues would be found here that would impact risks, ETCs, corrective actions, performance metrics.
     
Sprint Retrospective Reflect on the project, progress, people processes, what was good, what was bad, and take actions to improve. This should be the richest source of supporting information for EVMS root cause & corrective action within the VAR realm. Very timely for variance analysis as it happens potentially many times during work package (feature) duration.
Feature Retrospective (not one of the basic ceremonies) Review situation regarding technical scope deficit. Reflect on the project, progress, people processes, what was good, what was bad, and take actions to improve. Because this only happens at the end of the feature it is limited in value for variance analysis timeliness. Any lessons learned can only be applied to future feature work.

But where is the meat? Where do we get actionable data or at least data we can analyze to decide what management efforts are required?

There are numerous potential metrics that can be collected during these ceremonies. These metrics can form the basic data set that could be analyzed to define the root cause of cost and schedule variances. In addition to isolating the cause of issues, within some of these ceremonies the impact of the issue on the Sprint, or Feature, or team may be made. Certainly, these metrics can be used as the basis for projecting future workload and performance.

The total number of potential metrics is not known. In this paper, we looked at 17 metrics and considered what the data might mean. The results of this review are contained in this matrix:

Metric

Type of Measure

Discussion

Sprint Burn up/Burn Down Backlog Value of backlog remaining for Sprint. Decrease is expected when work is done. Increase means work increased. Burn up can include total completed plus remaining; a great metric.
Feature Burn Up/Burn Down Backlog Value of backlog remaining for Feature. Decrease is expected when work is done. Increase means work increased or shifted.
Customer support requests received. Disruption Number of instances. Unplanned interruptions by customer can lower the output of the team if excessive.
Disruption measures Disruption How many and what type (except customer support requests). Higher disruptions impact team efficiency.
Estimate Accuracy (Sprint or Feature) Estimating Measure of budgeted value (estimated value) for the Stories in the Sprint or Feature versus the actual cost (calculated cost) of the Stories when done. Related to team size.
Discovered work Estimating Emerging work discovered during the Sprint. Will translate to extra effort in future if adopted into backlog.
Exceeds WIP Limits Management If WIP limits are set on team or individuals then exceeding set limits will impact efficiency and output.
Retrospective Action Log Management Count of improvement actions listed in Retrospective. Increasing count means issues are not being resolved.
Attendance Management Comparison of actual hours worked by team compared to baseline expectations in plan.
WIP Productivity Measure of the number of stories or points in WIP at any time. WIP growth can indicate bottlenecks and inefficiencies.
Velocity Productivity Measure of the amount of work (Stories or Points) accomplished during a time period. Higher velocity means greater throughput per person/team.
Stability measures Productivity Comparing Sprint by Sprint basic measures from this list. If there is high variability between Sprints in measures, then future is unpredictable.
% Tests Automated Productivity Higher automated testing should increase efficiency & decrease cycle time.
Defects found by team Quality Number of bugs reported during team effort. Measures quality of work. Higher bug incidence translates to lower output and higher costs.
Defects found by customer Quality Number of bugs reported by user/customer. Measures quality of work delivered. Higher bug incidence translates to lower customer satisfaction and higher rework costs.
Pass/Fail (Re-do) measures Quality How does the rate of success in testing compare to the number of attempts? High success rate should mean greater output and efficiency.
Cycle Time Schedule Time from start of a story to complete. Short cycle time is desired.

Let us continue the theme of the behind schedule and overrun control account and look at what information would be available for support to developing the estimate-to-complete. An updated and refined backlog would have the scope of work remaining for the control account. The updated release plan would have the timing for the deliveries to be made in the control account. The metrics collected about the effort expended per accomplished story or story point would provide a factor for projecting future real-work hours. Planned corrective actions and improvements would tell us how we might expect improvement to the quality and improvement in the speed or cost of work. The insights available from a full set of metrics are impressive.

Does a project have to collect all of these metrics? If not all then which ones would be the right ones? Questions like that would be answered by the project management team analyzing their prior experience and the particular challenges of the project. The team would establish a data collection plan, likely described in their Software Development Plan or Program Management Plan that would explain the metrics, meaning, and frequency along with their purpose. With a clear understanding of the technical data to be collected and analyzed, the Control Account Managers would not have a difficult task to define how they would use that data in developing Variance Analyses and generating well-considered Forecasts. In fact, these tasks should be much simpler with the data in hand.

Agile/Scrum Ceremonies and Metrics Useful in EVMS Variance Analysis and Corrective Action Read Post »

Who Owns EVM? Programs or Finance?

, , , , , , , ,
earned value management: finance department or programsI have read several Earned Value Management (EVM) reports, papers, and articles that debate what company organization should “own” EVM and the company’s Earned Value Management System (EVMS). These debates most often mention the programs’ organization and the finance department as common EVM “owners.” The majority opinion seems to be that because EVM is a program management best practice it belongs in programs. A minority opinion is that because EVM is denominated in dollars, schedule included, and because EVM reports are financial in nature, EVM belongs in the finance department. Before we dive into this debate, a summary of the responsibilities of a Chief Financial Officer (CFO) and of the head of programs is useful. In our company A and company B examples to follow, both the CFO and the head of programs report to the company president.

WHAT ARE THE DUTIES OF A CHIEF FINANCIAL OFFICER ( CFO)?

A CFO has three duties, each measured in the time domain. The first duty of the CFO is as the company’s controller and is responsible to accurately and honestly report past company financial performance. The CFO is also responsible for the current financial health of the company – to insure that today’s decisions create rather than destroy value. And lastly, the CFO must protect the company’s future financial health and that all expenditures of capital maximize future financial health. Every business decision, especially those of the CFO, are either good decisions (are accretive – increase shareowner value) or are bad decisions (are dilutive – destroys shareowner value).

WHAT ARE THE DUTIES OF THE HEAD OF PROGRAMS?

The head of programs is typically a Vice President or higher and all program and project managers report to him or her. The head of all programs has profit and loss responsibility for his or her portfolio of programs and projects. In addition, each program is responsible for achieving the technical, cost and schedule requirements of the contracts it is executing on behalf of its customers.

A TALE OF TWO COMPANIES:

I will now describe first-hand experiences with two companies and how each company decided who should “own” EVM.

Company “A” had EVM assigned to the finance department. All EVM employees were overhead, even those assigned to a program. A new CFO arrived and quickly decided to reduce indirect costs, declaring that he was “coin-operated.” The new CFO terminated the employment of all EVM employees. Each program attempted to create an EVM branch office but failed. A level 3 CAR enumerating EVM deficiencies was issued and the CFO was fired. A second “new” CFO arrived and agreed to transfer EVM to the head of programs. The head of programs was instrumental in changing the disclosure statement making EVM personnel assigned to a program a direct charge to that program / contract. The head of programs created a Program Planning and Control (PP&C) organization and demanded all PMs and their program members to quickly learn, use and master EVM. A program control room was built with five screens. Daily 2:00 pm EVM data-driven reviews were held on short notice. These daily reviews became known as “CAM Bakes.” The EVM and program management culture changed quickly and dramatically at Company “A.”

Company “B” had EVM assigned to the CFO who was as “coin-operated” and unaware of EVM as the first “new” CFO of Company “A.” The culture of company “B” was very hostile to EVM, so it probably did not matter who “owned” EVM. The company failed 16 of 32 guidelines and was decertified. Significant withholdings were imposed and the company’s reputation was damaged. Several top managers hostile to EVM “sought employment elsewhere.” A new CFO arrived who was also “coin-operated” but expert in EVM. The new CFO formed a partnership with the head of programs. The new CFO was as much a PM as he was a CFO. The new CFO told his direct reports assigned to each program to “make the program managers successful.” And they did exactly that.

The new CFO understood that the company was the sum of all its contracts and that every dollar flowed from its customers. The EVM and program management culture at Company “B” changed rapidly.

Who Should “Own” EVM? Programs or Finance?

Returning to our original question of who should “own” EVM, the majority theory is that the Programs’ organization should “own” EVM. All else equal, I tend to agree with this theory.

However, while theory is suggestive, experience is conclusive. My experience at Company “A” proved that a strong programs’ leader could change the EVM and program management culture of a company rapidly. My experience at Company “B” proved that a CFO could “own” EVM and be successful at changing the company’s EVM and program management culture. The CFO and the head of programs must form an EVM partnership no matter who “owns” EVM.

Who “owns” EVM at your company?

Robert “Too Tall” Kenney
H&A Associate

Who Owns EVM? Programs or Finance? Read Post »

Scroll to Top